
Let's face it: data projects can be budget black holes. That's why measuring these initiatives' Return on Investment (ROI) is becoming as crucial as the analytics themselves. After all, nobody wants to be that person in the boardroom trying to justify why they spent a fortune on data tools without showing any tangible results.
In this article, we will roll up our sleeves and dig into measuring data analytics ROI. We'll break down some key ideas – what we mean by data product value, data downtime, and data investments. But it's not all about the numbers. We'll also explore how to value those trickier, less tangible benefits – like when your customers suddenly sing your praises because your data-driven insights helped you nail precisely what they wanted. Let's get started!
What Is Data ROI?
Return on Investment (ROI) is a metric that helps organizations understand the value they derive from their data initiatives. However, defining and calculating data ROI can be more complex than traditional ROI measurements. Many organizations use a straightforward formula to calculate the ROI of their data teams:
ROI = Value Generated / Investment
Yet, this approach often falls short of capturing the entire impact data teams bring to the table. The challenge lies in quantifying the value of various data initiatives that don't directly translate to immediate financial gains.
To address this complexity, Barr Moses, Co-Founder & CEO at Monte Carlo, offers to use the Data ROI Pyramid:
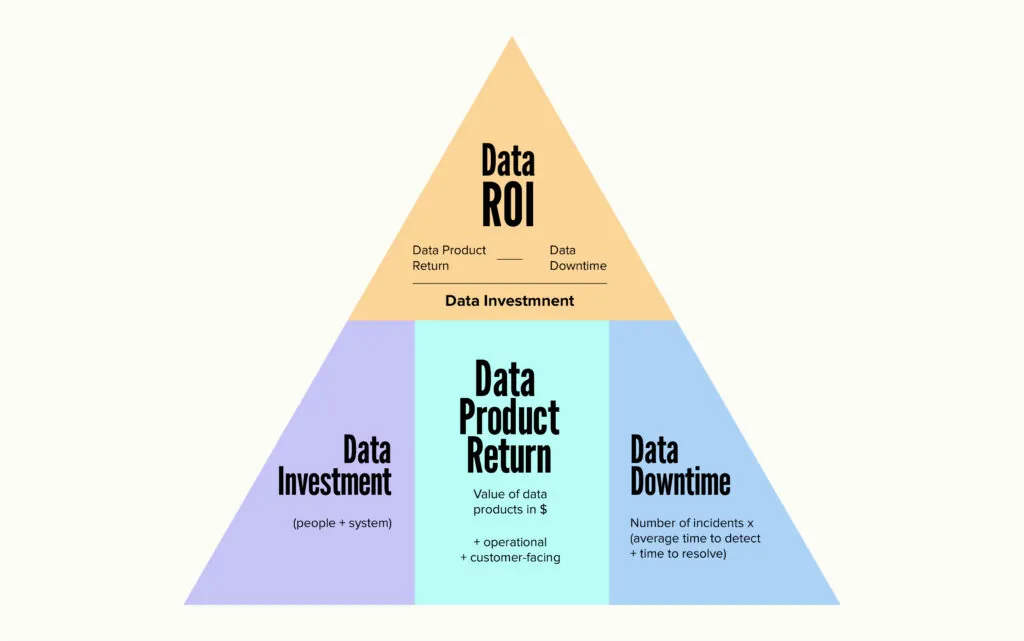
Source: Monte Carlo
Based on this approach, we can use a comprehensive formula that takes into account multiple factors to calculate Data ROI:
Data ROI = (Data product value - Data downtime) / Data investment
This formula provides a holistic view of data ROI by considering the value created, the impact of data quality issues, and the total investment made. Let's break down each component to understand them better:
Data Product Value
Data product value refers to the benefits gained from using data and analytics. This includes money from data-driven products or services, savings from improved operations, better business decisions, enhanced customer satisfaction, and reduced risks. To measure this value, organizations can look at the revenue generated, cost savings, productivity improvements, customer retention rates, and the number of new customers acquired through data insights.
Data Downtime
Data downtime occurs when data is unavailable or inaccurate. It directly impacts the value of data initiatives. Including downtime in ROI calculations is essential because it gives a clearer picture of data systems' reliability, reveals hidden costs from data issues, and encourages investments in improving data quality. Organizations can calculate data downtime by multiplying the incidents by the average time to detect and resolve those issues. This helps highlight the impact of data problems on overall ROI.
Data Investment
Data investment refers to all the costs associated with data projects. This includes technology outlay (such as hardware and software), employee salaries in the data team, retraining costs for employees on new tools, buying or collecting external data, and the recurring cost of maintaining data systems. Considering all these costs enables organizations to understand how much they are investing in their data initiatives – an important point if you want to calculate ROI correctly.
Alternative ROI Calculation Methods
While the comprehensive formula provides a holistic view, there are other approaches to calculating data analytics ROI that can offer valuable insights into specific aspects of your data initiatives:
Adoption-Based ROI
This method uses data and services, emphasizing the value derived from active user engagement. This approach is particularly useful for SaaS companies or organizations with user-centric data products. It helps understand how well your analytics tools are utilized and their impact on user value.
Formula: ((Value per active user * Active Users) / Cost of BI/Analytics App) * 100
Example: Your property management software company introduced new BI capabilities. After 6 months:
- Value per active user: $500 (based on increased efficiency and decision-making)
- Active Users: 1,000 (out of 5,000 total customers)
- Cost of BI/Analytics Feature: $200,000 (development and implementation)
ROI = ((500 * 1,000) / 200,000) * 100 = 250%
This shows that adopting your new BI feature generates significant value relative to its cost.
Data-Driven Changes ROI
This approach measures the impact of specific data-driven decisions or changes, focusing on the direct outcomes of analytics-informed actions. This method effectively evaluates the impact of individual data-driven initiatives or decisions, helping justify specific analytics projects.
Formula: ((Value of Change - Cost of Change) / Cost of Analysis) * 100
Example: A large property management client used your BI tools to optimize their pricing strategy:
- Value of Change: $150,000 (increased revenue from optimized pricing)
- Cost of Change: $20,000 (time spent implementing new pricing)
- Cost of Analysis: $5,000 (subscription cost for advanced BI features)
ROI = ((150,000 - 20,000) / 5,000) * 100 = 2600%
This demonstrates the high return on investment from data-driven decision-making enabled by your software.
Customer Satisfaction ROI
This method measures the impact on customer satisfaction metrics like Net Promoter Score (NPS) for customer-facing analytics. This approach is valuable for businesses where customer satisfaction directly correlates with revenue or retention rates.
Formula: ((Customer Value * New NPS) / Old NPS) / (Cost of Analysis) * 100
Example: After introducing the BI capabilities, you measure the impact on customer satisfaction:
- Customer Value: $10,000,000 (annual recurring revenue)
- Old NPS: 40
- New NPS: 55
- Cost of Analysis: $100,000 (development and implementation of BI features)
ROI = ((10,000,000 * 55) / 40) / 100,000 * 100 = 13,750%
This shows a significant improvement in customer satisfaction, which could lead to higher retention and referrals.
Product Increment ROI
This method suits product teams using data to drive feature development, focusing on the direct revenue impact of data-informed product decisions. This calculation helps product teams justify investments in data analytics for feature development and prioritization.
Formula: (Revenue from New Feature - Development Cost) / (Cost of Data Analysis) * 100
Example: Your company developed a new feature that allows property managers to forecast occupancy rates:
- Revenue from New Feature: $300,000 (additional subscriptions and upgrades)
- Development Cost: $100,000
- Cost of Data Analysis: $20,000 (market research and user behavior analysis)
ROI = (300,000 - 100,000) / 20,000 * 100 = 1000%
This indicates that the data-driven product development decision was highly profitable.
Data Maturity ROI
This approach “grades” your organization’s overall data maturity and associated dollar value for each grade or maturity level. Provides a broader view of data analytics's impact on organizational capabilities. This method is helpful for organizations looking to justify investments in overall data capabilities and culture.
Formula: ((Employees * Maturity Value $) / Data & Analytics Team Cost) * 100
Example: Your company invests in improving overall data capabilities:
- Employees: 200
- Maturity Value per Employee: $2,000 (estimated productivity increase)
- Data & Analytics Team Cost: $500,000 (salaries, tools, training)
ROI = ((200 * 2,000) / 500,000) * 100 = 80%
While lower than other metrics, this ROI suggests that investments in data maturity are paying off and contributing to overall company performance.
Best Practices for Measuring Data Analytics ROI
Measuring the ROI of data analytics initiatives is essential for demonstrating their value and guiding future investments. By following these best practices, organizations can ensure that their data efforts are aligned with business goals and effectively contribute to overall success.
Align with Business Objectives
Ensure your data initiatives and ROI measurements align with your organization's goals. Before launching projects, start by identifying key business objectives. Map your data efforts to specific outcomes and create metrics that reflect these priorities. Regularly review this alignment to keep your initiatives relevant.
Start Small
Begin measuring ROI with specific projects or departments rather than attempting a broad approach. Choose pilot projects with clear, measurable outcomes and focus on areas where data can immediately impact. Use these smaller projects to refine your measurement techniques before gradually expanding to larger initiatives.
Involve Stakeholders
Collaborate with different departments to understand how they use data and the value it brings. Meet with department heads to discuss data needs and create cross-functional project teams. This collaboration helps develop a shared understanding of value across the organization and refines your ROI metrics.
Regularly Review and Adjust
Recognize that measuring data ROI is an ongoing process. Set up regular review cycles for your initiatives and be ready to adjust metrics as business needs change. Use feedback to improve your data processes and stay flexible as your organization matures in its data capabilities.
Communicate Results
Share your ROI findings with the project leaders and stakeholders to explain the value of your data initiatives. Create clear reports tailored to different audiences with simple visualizations to make insights more accessible. Highlight successes and improvement areas and link results to strategic business goals.
Consider Intangible Benefits
While quantitative measures are important, don't overlook intangible benefits. This includes improved decision-making, data literacy, increased competitive advantage, better compliance, higher employee satisfaction, and excellent innovation capabilities. By including these factors in your ROI assessment, you can get a more accurate picture of the impact of your data initiatives.
Conclusion
Measuring the ROI of data analytics is important to justify the investment and set a blueprint for the future. A holistic approach that includes the worth of data, downtime, and investment enables organizations to realize the actual impact of their data pursuits. The various methods to calculate ROI and flexibility accommodate all types of data projects for evaluation.
Quantitative measurements are essential, but the 'soft' benefits include better decision-making, greater data literacy, and improved competitive advantage. These factors contribute significantly to the overall value of data analytics initiatives.
Contact us to learn more about our approach to strategic collaboration and ways we could help your business with strategizing and claiming ROI from data analytics.