
Power Query is a tool integrated into Power BI and Excel, designed for data transformation and preparation. It allows users to reshape, clean, and combine data from multiple sources. When transformations cannot be performed at the source or in a prior ETL layer, Power Query becomes particularly useful. We could classify it as a low-code application that allows us to perform multiple data-cleaning actions with just a few simple clicks. Although its user-friendly interface allows inexperienced users to improve the quality of their data and reduce some manual processes, incorrect use can also lead them to pitfalls that would be better to avoid.
In this article, we’ll explore the best practices recommended by Microsoft documentation for optimizing Power Query in BI projects. Although the post is devoted to Power BI, remember that this approach could also be applied to Excel.
Select the Right Connector
The initial step in working with Power Query is to obtain data from the source. When the user clicks the "Get Data" button on the Data tab, a dialog window opens, presenting an extensive list of pre-designed connectors. These connectors facilitate communication between Power BI and various services, allowing users to connect to and utilize data from those sources without the need for additional drivers.
Each connector provides an experience that follows a series of standard steps before reaching the target data, such as connection settings, authentication, data preview, and query destination. The steps may differ depending on the service and the connector selected.
Suppose there are no available connectors related to the source where the data is stored. In that case, the user can select the ODBC connector, a generic option that enables connection with other sources.
This may lead us to the question of why there are specific connectors for certain data sources or why we should not always use the generic ODBC connector. The answer is that the existing connectors are customized and optimized for the specific data source. This becomes important when the source is a database since the non-use of the specific connector could break the “query folding,” a functionality within Power Query that translates commands applied into the language of the data source (that is, SQL).
In this way, the Power Query engine optimizes the query and gets only the data needed from the source according to the steps applied in the Power Query recipe. It is worth mentioning that the use of the specific connector does not guarantee that the query will be folded (either in whole or in part) since not all Power Query commands can be folded, and also, the order in which they are applied may break the folding. That said, choosing the specific connector gives us a better experience by allowing us to use an optimized connection.
Filter as Early as Possible
The well-known recommendation is to apply a filter to the data in the first steps of the query recipe as early as possible. This will allow us to remove unnecessary data from the beginning of the transformation process. The following query steps may include complex transformations (such as joins or unions, or even custom formulas) that require designing and applying certain logic to achieve the desired result, which must also be sustainable over time.
Keeping unnecessary data may further complicate these types of transformations or lead to specific undesired errors that compromise development. However, we may still need to apply filters in the final stages of the query to achieve the desired output our model needs.
On the other hand, and related to the choice of the connector, filtering is one of the native functions of Power Query that can be folded in the source when supported (databases). In this way, when Power Query establishes a connection with the source to request the data, it also sends the filtering instructions. The data source will evaluate the request containing the filtering instruction and then return the resulting data, so the Power Query engine receives only a part of the whole dataset, reducing the amount of data to be processed. This can help transformations to be faster and thus increase performance.
Do Expensive Operations Last
It’s worth saying that the sequence matters in Power Query. As mentioned earlier, the wrong order of the steps in our query recipe could break the ability to fold the query in the source. On the other hand, some transformations that we call expensive may affect the performance and the experience with the tool, so it will be nice (if possible) to execute them last.
Let’s think about a database with thousands of records, where each transformation applied will need to scan the whole dataset. It will result in a tremendous lag that will turn our work inside the Power Query engine into a terrible experience. To avoid this, the transformation is evaluated from a portion of the data stored in the cache (usually around 1000 rows) without evaluating the applied command against the entire dataset. This type of evaluation is known as lazy evaluation and contributes to optimizing the workflow within Power Query and improving the user experience.
When we work with Power Query, the data we see is a preview of the entire dataset. So, when a transformation is applied, only the data in the cache will be evaluated to return the results and refresh the preview. This is what happens, for example, when a filter is applied. It’s unnecessary to scan the entire dataset to return the results and refresh that preview, but evaluate the data already stored in the cache and any data that may be entered as the data flows.
In contrast, the expensive transformations need to scan the whole dataset to return a result, which means there is some lag in updating the preview. A good example of transformations is changing the order of the data in a column, where the requested sorting may involve displaying some records that are very deep in the dataset in the first order. To bring them into the preview and sort them properly, Power Query will need to scan the entire data.
This is why a good strategy to improve our experience when working with Power Query is to place those expensive operations at the end of our transformation pipeline. This will contribute to faster previews, where the computing resources will be used efficiently, improving the workflow, exploration, and data transformation.
Use Correct Data Types
When working with data types, we must be clear about what it means and how it differs from the format:
- Format: is a property related to how data is presented or displayed without changing its underlying structure and precision.
- Data Type: is a property related to the data structure, which allows us to control the precision of the values by changing the underlying structure.
To understand it better, let's see it with an example, in this case, from the Power BI interface where we can manipulate both types:
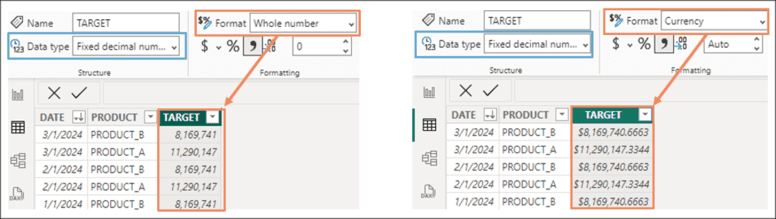
The TARGET column has been set with the “Fixed decimal number” data type, but the display format is “Whole number.” Although they are not visible, decimals are part of the structure of the values and will be considered if operations are performed with them. If the display format is changed to “Currency,” we can see the decimals.
Having clarified this, we now need to understand how Power Query behaves with the available data sources. When working with flat file data sources (for example, a CSV), we must consider that they do not contain the schema or metadata layer that can be found in other cases. In the absence of this layer, Power Query automatically detects data types. Sometimes, the program's choice is incorrect, and the user must change it. Since Power Query uses a flat file without metadata, it applies the locale of the user's computer by default, which may not be correct. Data types are derived from a table or view schema when working with structured data sources, such as databases.
The developer must verify and choose the correct data type in the columns, whether the program has assigned them automatically or inherited from the data source. The choice should be aligned to the project's needs and requirements: Does my report need to include the time of the event in addition to the date? Does my report need to include decimal precision in the numerical values?
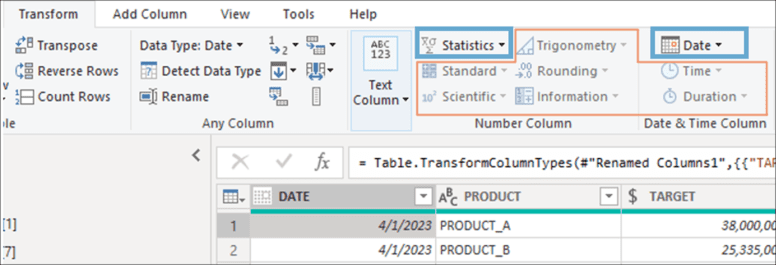
The definition of the data type is a crucial decision in any BI project. On the one hand, this affects the data model once the transformations are finished in Power Query, since the data is stored differently depending on the type and may take up more or less space. Data in integer type can be compressed and stored better than decimals (float). On the other hand, some features of Power Query depend on the data type chosen, so if the choice is incorrect, you may experience some limitations. For example, when working with a date column, of all the functions offered in the Transform tab, only those related to Date and Statics can be applied since they are available according to the data type in use, leaving the others disabled.
Also, some Power Query functions require a specific data type to work correctly. If this action is applied to a column whose type is incorrect, the results may not be as expected, and errors may be encountered when loading the data into the model or executing a refresh.
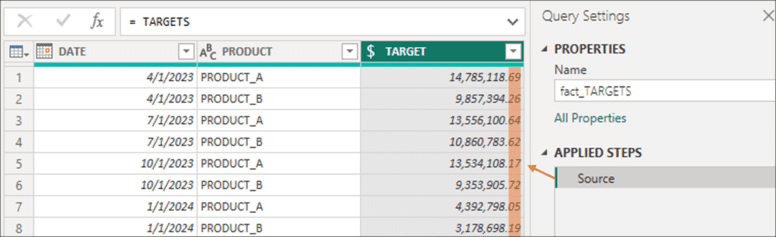
Finally, as in the previous item, the order also matters when working with data type. Sometimes, because of bad practices, users try to undo the result of a type changed in a previous step by adding a new step where the original data type is applied. Unfortunately, this will have no effect. The type change modifies the data structure, which may imply the loss of some information. Let's see it better with an example. The data in the TARGET column has been loaded with the “Fixed decimal number” type:
Next, the user adds a step in the transformation and changes the data type to “Whole number”:
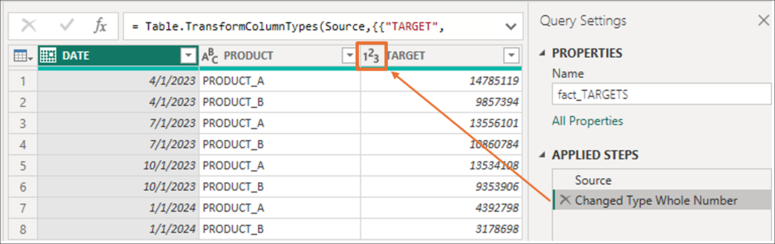
Then, a transformation is performed on the PRODUCT column to back the TARGET column to the initial data type. Although the data have changed to the “Fixed decimal number” type, we can see that the decimals are now ".00":
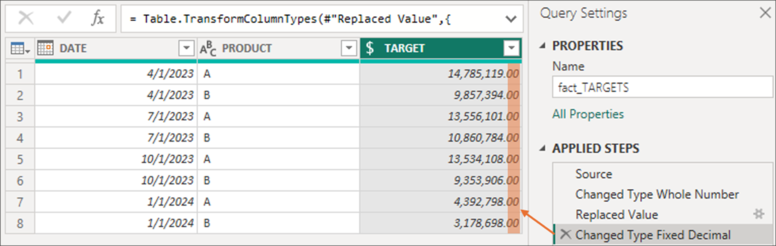
What happens here is that the decimal precision has been lost due to the step that changes the data type to “Whole number.” As mentioned, this implies a change in the information's structure, and this loss cannot be recovered even if the user adds another step with the numbers' initial data type. To undo this action, the user must delete the step in which the change in data type occurred, which alters the data structure.
Use a Modular Approach
It is common to work on projects that become more complex to understand as they grow. Although the structure of Power Query allows each query to contain multiple steps, sometimes it can be a good option to separate them into different queries as if they were layers to facilitate understanding. This approach can help manage our queries as the solution grows and becomes more complex. The criteria for splitting and separating the steps of a query can be different depending on the transformations applied, resulting in two, three, or more subqueries.
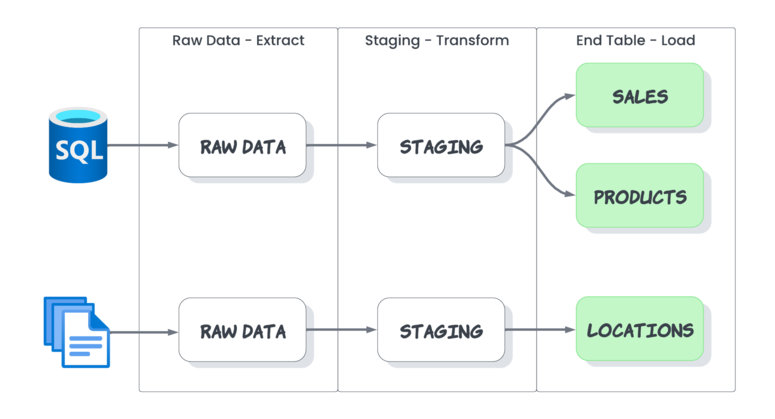
Although there is no convention on how to do it, a good approach is proposed by Ken Plus and Miguel Escobar in the book "Master your data with Power Query in Excel and Power BI". The authors propose a standard with queries for each phase of the ETL process, resulting in 3 queries:
- Raw Data (E – Extract): contains the necessary steps to extract the data from the source, which can be used as a reference to consult the available records.
- Staging (T – Transform): the purpose of this query is to contain most of the transformations to clean and prepare the data.
- End Table (L – Load): it is the table resulting from applying the transformations where the data that will be later loaded to the model are located, and that as a good practice should have the name of the final table.
Only the End Table is loaded inside the model in this approach, while the others remain inside Power Query. Initially, performance should not be affected since Power Query has a node caching feature, where the refresh results are cached and reused by other queries in the same refresh sequence.
Using the image above as an example, the STAGING query sequence whose data source is SQL will be generated only once and stored in the cache, which other queries can reuse. Thus, SALES is connected to STAGING, which takes the data from the cache and makes the transformations to load the data in the destination. On the other hand, PRODUCTS will perform the same process using the cache information to select the data that will finally load.
Among the advantages of this approach is that the Raw Data query allows control of data coming from the source from a single place and establishes which data will be available for the next stages of the process. In addition, queries can be reused by other queries for different transformations.
However, for this approach to be applicable, good standards must be maintained in terms of the order of the queries, their organization, and their names. If the number of queries grows, either because there are several data sources or because several tables need to be loaded, it can result in many subqueries, making it difficult to trace their lineage.
At the same time, one of the most difficult milestones is ensuring that all work team members adopt and understand the approach since the same logic must be applied in each work session to avoid ambiguities and confusion. On the other hand, in some specific cases where complex transformations are performed, it may be more convenient to keep everything in the same query to maintain the whole's vision and better understand how it works.
In conclusion, this way of working is not a standard but an approach where the convenience of its application and the way to carry it out must be evaluated according to each situation.
Use Parameters
Parameters allow us to store values that can be used differently. One of the most common scenarios where they can be applied is in the connection to data sources. Let's imagine that our workflow involves the first stage of developing the solution using data from the development environment database. Once the development stage in Power Query is finished, we will need to connect our queries to the production data. To modify the connection, we will need to make changes to each of the queries that point to the data source, which would imply entering each and making the change.
Although this manual method is effective, it can become tedious when we have many queries pointing to the source, and many mistakes can be made.
Therefore, a good option is to use parameters to establish the connections. For this, we first need to create the necessary parameters and then be able to place them in the queries. Thus, every time we need to switch between the different environments, we must change the parameter value from the control panel provided by Power Query, from where we can manage them.
On the other hand, in advanced use cases of Power Query, the user can build their custom functions. In this case, parameters can be used as arguments within these functions providing dynamism and flexibility.
Parameters can also be used as arguments to set filters. One possible scenario is to combine the use of parameters with the approach of working with subsets of data: when there are queries containing several steps applied to large datasets, we may experience delays in the workflow, so it is recommended to work the query from smaller dataset and, from it, apply the necessary transformations. The smaller volume of data helps to reduce lags and optimize the workflow. Once the query is built, we can let the rest of the data be processed.
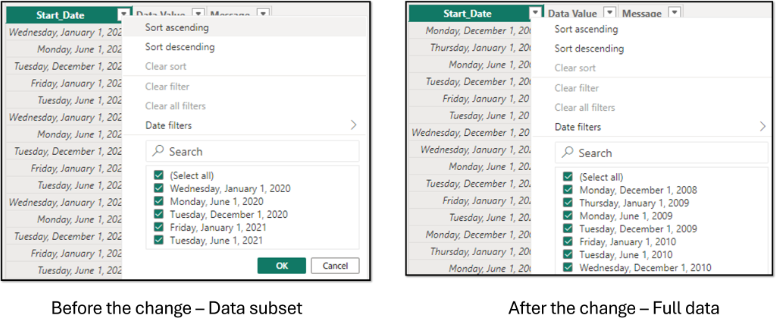
This is where the parameters can filter the data processed by the query. Once the query is assembled, the user can load the table into the model using the temporary sample data. In the example below, the subset of data is made up of records after 12/31/2019:
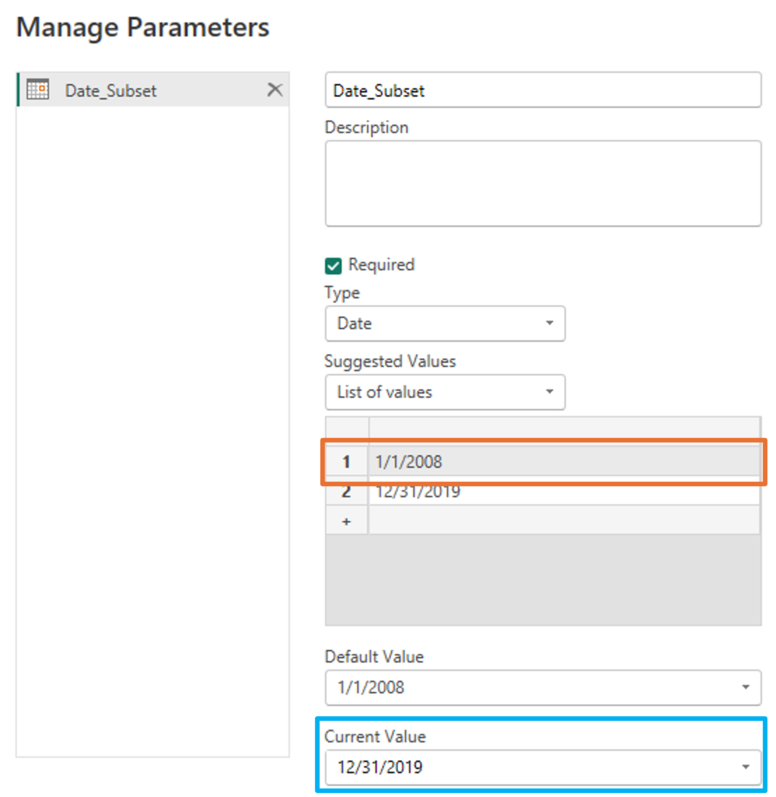
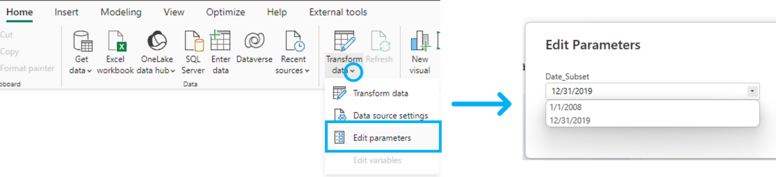
In addition, we have defined the second value (the default value, unless changed) at the beginning of the year of the oldest date in the dataset, so if that date is selected, we will see all the data. Once the query is ready, we load the transformations to the Power BI model, which will only contain the subset of records after 12/31/2019. Then, with our data already loaded in Power BI, we go to the Home tab, and there Transform data → Edit parameters. This will open a window with the parameter values, from where we can change the parameter to the oldest date, which will start a refresh that will process the complete data set according to the applied transformations.
We can then go to the table view in Power BI to check if the data has been entered completely:
Prevent Unnecessary Data in the Future
Another thing to consider when working with Power Query is that we should try to build future-proofing queries. The goal of this is to have queries that are sustainable over time. On the one hand, we need to prevent errors and have the query refreshed completely even when there have been changes in the source.
On the other hand, we need to prevent changes in the data source from adding unwanted or unvalidated data. Meeting this goal may have additional complications when working in different environments (DEV, TEST, PROD) where sometimes data may not match. Several strategies can be applied depending on the data source we connect and the transformation being applied.
A common action is applying a transformation to limit the number of columns to keep only the desired ones. The strategy is to prevent columns with unwanted or unvalidated data from being loaded into the model. This is where we must pay attention and choose the right transformation. Power Query offers two ways to reduce the number of columns, but both have different implications.
In the following example, we have a dataset of twelve columns, of which we only want to keep Unique ID, Indicator ID and Name. The first way to achieve this is to mark the other nine columns and remove them with the Remove Columns button in the home tab or from the quick menu that appears when right-clicking on a column.
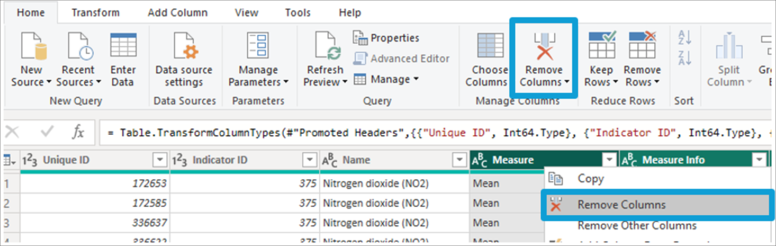
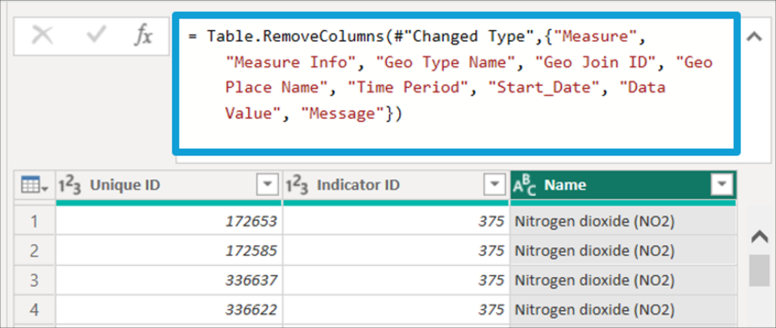
Despite achieving the goal of removing the unwanted columns, this query is not future-proofing since Power Query applies the Table.RemoveColumns function that lists the name of the removed columns. Thus, in case of a change in the data source where one or more columns are added, they will be passed to the model since they are not listed.
On the other hand, if any of these columns are removed from the data source, we would encounter an error when refreshing the model since the query is invoking a column that does not exist (we may also encounter the error in the refresh if any of the listed names change).
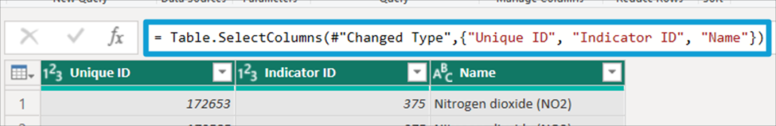
The alternative way to do this, which would also be the appropriate one, is to select the columns to keep and choose the Remove Other Columns option (the same action can be performed with the Choose Columns button in the Home tab, or with the Remove Other Columns option that appears when the Remove Columns button is displayed).
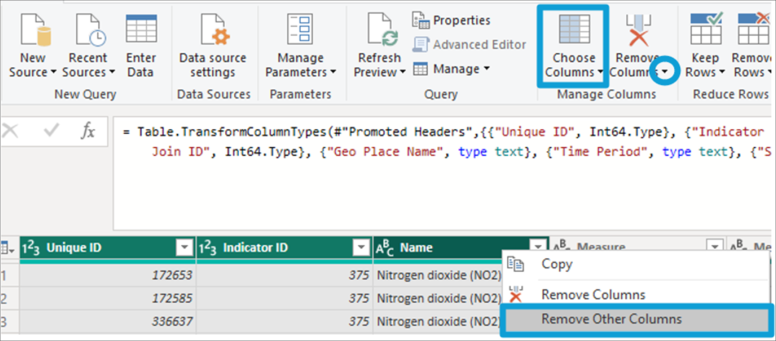
In the image below, we can see that Power Query calls the Table for this transformation.SelectColumns function, where only the columns to keep are listed. This ensures that in case of changes in the source, we will not have unwanted columns or errors in the refresh due to missing columns.
As mentioned, implementing strategies may also depend on the data source. It may be common that we need to establish a connection with worksheets contained in xlsx files. These files are often the product of business users' manual work and can take on a dynamic we must know. Here we can find rows or columns with blank records, partly due to the high manipulation these files usually suffer and how Power Query reads and interprets the range where the data is located. The strategy for handling columns could be like that described above. In the case of rows, it is possible to use the Remove Blank Rows option found in the Remove Rows button options on the Home tab.
In summary, given that we may encounter changing scenarios, developing a future-proofing query is a challenge that requires proper data exploration and knowledge of the processes (manual or system) that may cause changes in the data source.
Data Load in the Background
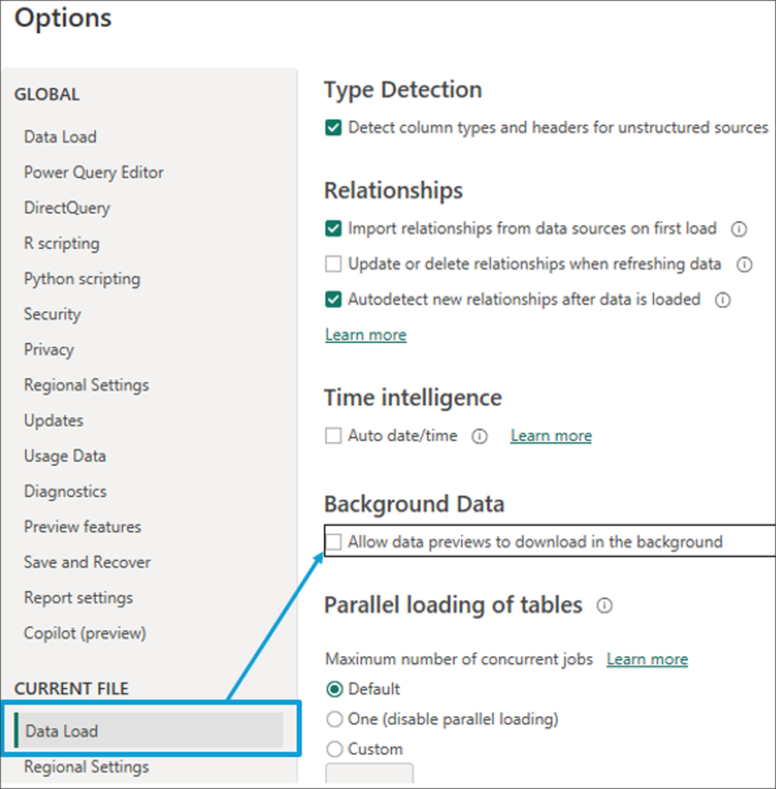
In Power Query, we can manage some options related to data loading. One is Allow data preview in the background, which can be found in the Power BI settings in the Current File section.
To understand what this is about, let's remember that Power Query shows us a portion of the data, around 1000 records, on which we can check the result of the transformations we apply. By enabling the option, we are allowing the automatic update in the background of the cache of all the queries of our project, even those with which we are not working.
The advantage is that when changing from one query to another, we can have a cache preview of the most recent data from which to continue with the transformations or review the steps applied.
Despite this, the tool may perform less smoothly due to increased RAM consumption, since generating preview data and caching it in the background automatically is part of the project queries. If our project contains multiple queries, the consumption of resources (CPU and RAM) will likely increase significantly, and it may even happen that our work will be interrupted until some of these background refresh processes are finished.
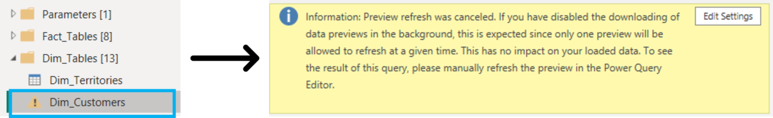
To avoid this downside, you should disable this option so that the query will only be processed when selecting it or requesting a data refresh. The disadvantage is that the selected query may take a few moments until we can start working on it while the data preview is generated. As a result, we may see a question mark (?) in many of the tables. This means that the query could not be fully evaluated, since the evaluation process was interrupted. As the data load in the background option is disabled, the preview will not be refreshed until the user does it manually.
Operation Excellence
Finally, we will mention some good practices that, although not related to performance, help to optimize the workflow from the point of view of order and organization.
The first of these tips points to the proper naming of queries. The name we assign at this stage is the name we will later see in Power BI in the tables that are part of the semantic model. The name should represent the data in the query to identify it while working on our transformations. We should avoid spaces and special characters, making our work easier when invoking those tables during the data cleaning stage or even when creating metrics with DAX. The same advice fits to the column names.
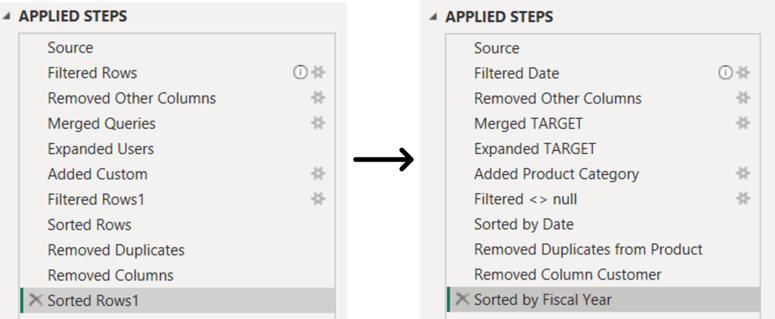
We should also pay attention to the name of the steps that are part of the query recipe. Power Query assigns these names by default according to the action applied by the user. If the action is repeated, we will see a number next to the step name (e.g. Filtered Rows 2) because the M code does not allow two steps with the same name in the query. The idea here is not to get creative but to assign a name to help us understand what transformation is being done in each step and identify it if necessary.
In turn, it should be mentioned that if a space is used in the names of the steps in the APPLIED STEPS panel, the code generated in the M language will enclose it in #"" in this way: #"Promoted Headers". If instead we replace the space with a _ the M code will display it like this: Promoted_Headers. In the M language, the steps are known as Identifiers. When no spaces are placed, they are considered Regular Identifiers, while when we place one or more spaces or other special characters, they will be considered as a Quoted Identifier. This allows Power Query to avoid ambiguities and prevent conflicts with other reserved words in this language. This should be considered, especially if we work on editing the M code, since avoiding quoted identifiers can make our task easier.
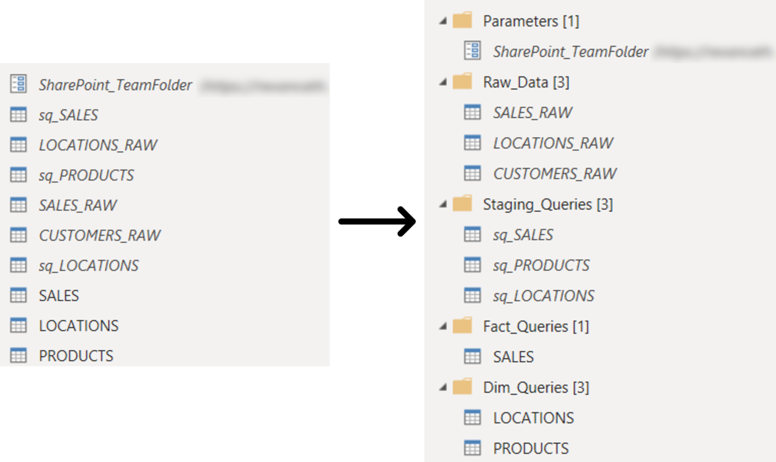
As for the organization of the queries, it is possible to group them in folders. The grouping can follow different criteria depending on the number of queries and the transformations performed. Below is an example of the queries organized by folders according to the modular approach discussed earlier, where we separate the queries with the parameters that have been created. The queries with the raw data from the source, those containing transformations (staging), and then those that will be loaded to the model which is divided according to whether they are a fact or a dimension tables:
While these small tips have little or no impact on performance, they can be beneficial in optimizing the workflow. They allow us to standardize our Power Query projects and make it easier to maintain them over time.