
IT systems are not only growing in size and volume but in complexity as well. Thus, it’s only natural that more personnel is required to service these systems.
Moreover, requirements for systems’ fault tolerance are increasing and require more attention from the service personnel along with a quick response to the restoration of the services’ operability.
New and diverse ways of monitoring said parameters are emerging to improve the process of observing and tracking various systems’ operations. It’s challenging to track the performance of systems in terms of time series data since the number of monitored parameters can be too massive for simple human observation. Also, the amount of data that comes in a unit of time is huge.
The Time Series Database aims to efficiently store and monitor IT systems’ data. In this blog post, we will explore where these types of systems are used and how they are arranged using the example of the common Time Series Database Prometheus.
Table of contents:
- What is a time series database?
- What is Prometheus?
- Where and why is Prometheus used?
- How does Prometheus collect metrics?
- Pull Mechanism in Prometheus.
- PromQL Query Language.
- Conclusion.
What is a time series database?
A time series is a series of data points indexed (or listed, or plotted) in chronological order. Most often, the time series is a sequence taken at equidistant points in time that follows one another. Thus, it is a sequence of discrete-time data.
Time series are very often represented by line charts. Time series DB are used in statistics, signal processing, pattern recognition, econometrics, financial mathematics, weather forecasting, intelligent transport and trajectory prediction, earthquake prediction, electroencephalography, automatic control, astronomy, communication technology, and largely in any field of applied science and engineering, which includes time measurements.
There are three entities in time series:
- What are we looking at?
- When are we looking at it?
- What value does it show?
What is Prometheus?
As mentioned on the developer’s website “Prometheus is an open-source systems monitoring and alerting toolkit originally built at SoundCloud. Since its inception in 2012, many companies and organizations have adopted Prometheus, and the project has a very active developer and user community. It is now a standalone open source project and maintained independently of any company. To emphasize this, and to clarify the project's governance structure, Prometheus joined the Cloud Native Computing Foundation in 2016 as the second hosted project, after Kubernetes.” Prometheus is written mostly in Go and components communicate over HTTP.
For viewing data, Prometheus DB has its own graphics display system, but it can work in conjunction with systems like Grafana.
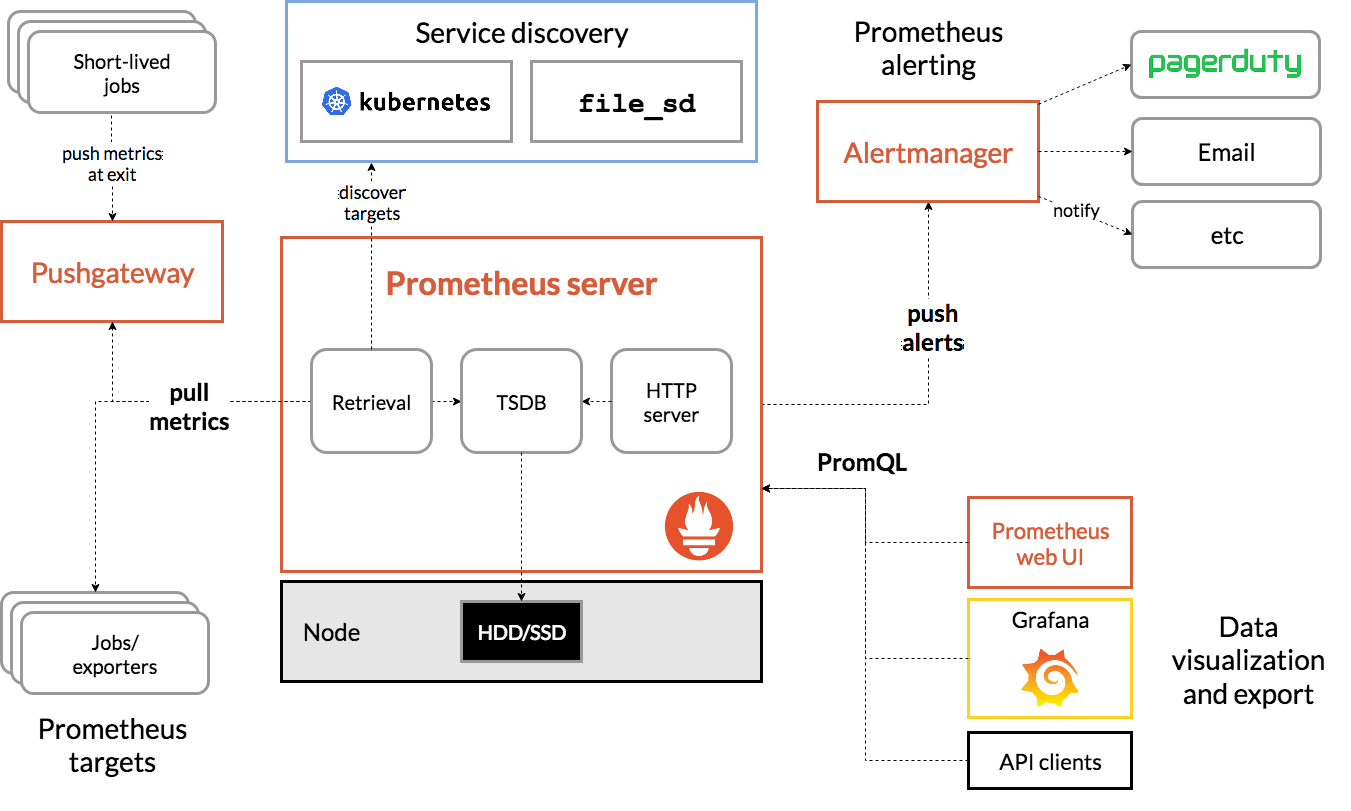
Image source
Components included in the monitoring system:
- the Prometheus server itself
- client libraries
- push gateway to work with short-term processes (when the service is running in a much too short time for Prometheus to be able to make requests to it to get metrics)
- exporters to collect metrics from a third-party service (there are millions of these types of exporters and their name is legion)
- alertmanager - notification manager (Slack, mail, etc.)
Some of the main features of Prometheus are:
- Data Collection and Usage
- Storage key-value tagging along the time series
- Visualization and Dashboards
- Plug-In Architecture and Extensibility
- Alarm and Event Tracking
- Cloud Monitoring Capability
- Large active community
What database does Prometheus use? It is a very well-designed system with a sophisticated local storage sub-system. To manage indexes effectively, LevelDB is used. Please find out more information about time series database on this page.
Where and why is Prometheus used?
Prometheus is not only a time series database; it’s an entire ecosystem of tools that can be attached to expand functionality.
Prometheus monitors a wide variety of systems like servers, databases, individual virtual machines, IoT, machine learning models, and many more. Prometheus is now becoming an indispensable component in high-load microservice systems and SOA.
Prometheus retrieves metrics via HTTP calls to specific endpoints specified in the Prometheus configuration.
Prometheus retrieves data from the address specified in the configuration at regular intervals and provides a mechanism to store and process said data.
Prometheus has a central component called Prometheus Server that stores and monitors certain objects. An object can be anything like a Linux server, an Apache server, a process, a database server, or any other system component that you want to control.
In Prometheus lingo, the main monitoring service is called Prometheus server where the monitoring objects are called targets. A target can be a single server or endpoint validation targets over the following protocols:
- HTTP, HTTPS
- DNS
- TCP and ICMP (Black-Box Exporter),
- a simple HTTP endpoint that an application issues.
The Prometheus server checks the application’s status through the HTTP endpoint.
Each target element that you want to monitor (CPU status, memory, etc.) is called a metric. Prometheus collects metrics from targets over HTTP, stores them locally or remotely, and display them.
The Prometheus server reads targets at given intervals defined by you to collect metrics and store them in a time series database.
Metrics in the Prometheus time series database are stored using the PromQL query language. PromQL enables you to request Prometheus to display the status of a specific target at a given time to obtain metrics.
Prometheus provides client libraries across different languages that you can use to keep your application running. With that being said, Prometheus is not about app monitoring only. You can use exporters to monitor third party systems like a Linux server or a MySQL daemon. The exporter is a piece of software that receives existing metrics from a third party system and exports it to a format that Prometheus can understand.
It’s worth noting that Prometheus uses a standard data model with key-based metrics that may not match the third party system model.
Prometheus can be used as a time series data service. It is really easy to deploy the prometheus time series DB to your favorite cloud system. You can also use a managed service for Prometheus such as Google Managed Service for Prometheus. Please find more information here.
Prometheus time series collection and processing server can be placed into containers. Please refer to the following guide on how to configure docker containers on this page.
How does Prometheus collect metrics?
As described on the developer’s website “Prometheus collects metrics from targets by scraping metrics HTTP endpoints. Since Prometheus exposes data in the same manner about itself, it can also scrape and monitor its own health.”
Prometheus metrics can be organized in several ways:
- Some applications already know how to display their metrics in a format that Prometheus understands, for example, etcd and Kubernetes. The etcd even listens to incoming requests for metrics so it's simple to connect it to Prometheus.
- There are exporters for a lot of other applications. The exporter is a small web server that collects metrics from the application and distributes them to everyone “at / metrics". There are a lot of exporters, ranging from collectd, Apache, and RabbitMQ to more far-off things like the development board.
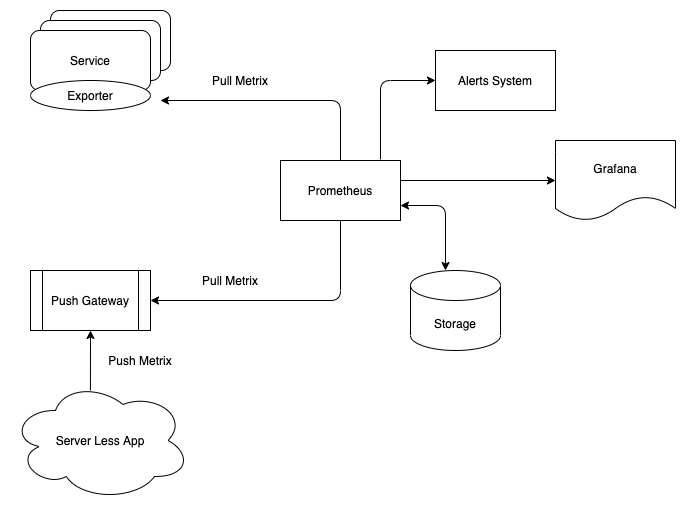
There are situations where Prometheus cannot make a direct HTTP request to the application. This happens when using a firewall or when there is not enough power to withstand the additional load on requests. If the application can use a pushgateway (intermediary that can receive data), it can then give it to Prometheus in a standard way via metrics.
Pull Mechanism in Prometheus
There are two conceptually different approaches to collecting application metrics. There is a PUSH approach, in which the repository sits quietly and hopes that a random metrics provider will put something into it. For example, Graphite does not collect data; instead, it expects someone like collectd to deliver them right to their doorstep.
The other approach is PULL. Here, the aggregator begins to take the initiative and, once every x seconds, it goes through the list of addresses to which it is subscribed to independently collect a new portion of data.
PromQL Query Language
PromQL is a query language used in the Prometheus timeseries monitoring system. PromQL is different from other alternative queries for time-series databases such as SQL, InfluxQL, or Flux, or from the query language used by Graphite.
Considered by many as the best database for time series data, Prometheus provides various data types for storing information in a comfortable format.
As mentioned on PromQL documentation, it supports the following data types:
- Instant vector - a set of time series containing a single sample for each time series, all sharing the same timestamp
- Range vector - a set of time series containing a range of data points over time for each time series
- Scalar - a simple numeric floating-point value
Once the data has more than one dimension, you have to acquire a query language as well. Prometheus supports many binary and aggregation operators as well as several functions to operate on data. Also, when queries are run, timestamps at which to sample data are selected independently of the actual present time series data. Prometheus query language is effective and powerful.
Conclusion
Prometheus is one of the best time series database and it is a very good tool for processing and monitoring time series data. This versatile tool can be used with Graphana, a statistics visualization, and anomaly observation tool. This tool can collect data from highly loaded servers, various IoT devices, complex data processing systems, and many more.
Our Svitla Systems specialists can provide you with a reliable time series database and develop a full-fledged information system for your specific monitoring and surveillance tasks.
In some cases, processing new data can slow down Prometheus when building queries in PromQL. Our specialists have the necessary experience and will work with your data to ensure everything functions reliably and without failures. Our Svitla engineers are also proficient in the timely detection and reporting of data anomalies.
Contact us so we can begin working on your system data and help you reach your goals.