The problem of project management will exist everywhere and always, regardless of the complexity of the task performed, whether it be building a hut, the pyramid of Cheops or a spacecraft for a flight to Mars.
And the destiny of the project will depend on the skill of the project manager as much as on the skill of the project executor. These two roles are dependent on each other. You can build a very large boat but have no way to launch it, due to poor planning.
What is a project in general? How did the concept t arise and why is it needed in the 21st century?
A project in engineering is a set of models and design documentation, which contains design decisions and gives a complete picture of the structure of the product, process or organization to be developed.
Project in Documentation is the preliminary text of a document.
A project in project management is a unique set of processes that are limited in time, resources and quality requirements, aimed at achieving unique goals and objectives for creating new value (product or service).
Design in design is the concept, the idea of creating an individual style space or product, taking into account their functional purpose.
According to the PMBOK organization’s definition, a project is an action aimed at creating a unique product, service or result.
For example, building an information system is a project. Moving to a new office is a project. Making coffee several times a day for yourself and your loved ones is an operational activity since the result is not unique and the action is repeated many times (although it is rather difficult to make two identical tasty coffees).
What are the goals of project management and why this should be taken very, very seriously?
The main goals of project management, whether for a large or small project, are to:
- correctly evaluate the stages and components of the project
- properly assess the necessary resources for implementation
- arrange the project stages in time
- find the relationship of the project stages and build them in the right sequence
- correctly assess the risks and implement anti-risk measures to reduce or eliminate them
In order to fulfill all these requirements, to finish within the budget, time and with the required quality, people began to seriously think about how to improve the design and planning process.
And one very clever man, Henry Gantt in 1910, proposed a very interesting method for creating a project diagram, which allowed for visually evaluating the project and tracking the correctness of its implementation. This simple diagram saved an unknown number of projects and very much helped out hundreds of thousands of project managers.
One of the first major applications of Gantt charts was during World War I in the United States by General William Crozier.
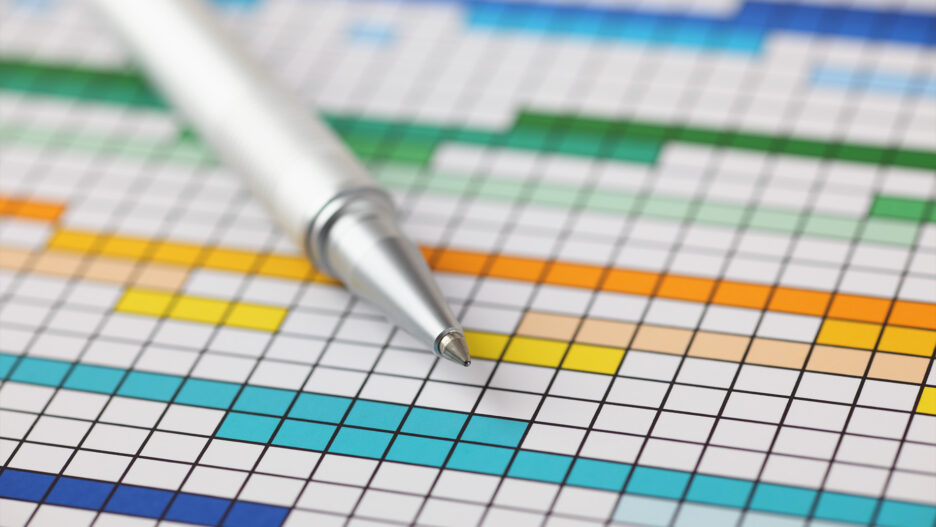
A very good example of a Gantt chart is placed here. It shows the tasks and timeline, as well as the dependencies of tasks. It visually represents the sequence of tasks and allows project managers to pay attention to the current status of tasks and control the timeline and resources.
Type of dependencies in Gantt chart
There are four types of dependencies between tasks. It allows describing the most typical relations, between task start and task finish. If you need to set relation in the middle of a task, it is easy to split the task into two tasks and then set the necessary dependency.
Fig. 1. Example of Gantt chart
| Dependency | Function |
|---|---|
| Finish to Start | Task B can't start before Task A is finished |
| Start to Start | Task B can't start before Task A starts. |
| Finish to Finish | Task B can't finish before Task A is finished |
| Start to Finish | Task B can't finish before Task A starts |
The following images show the dependencies in a diagram.
Fig. 2. Dependency “Finish to Start”
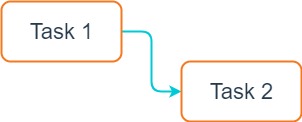
Fig. 3. Dependency “Start to Start”
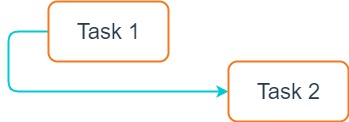
Fig. 4. Dependency “Finish to Finish”
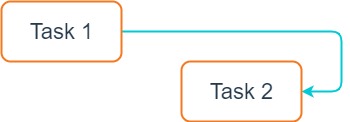
Fig. 5. Dependency “Start to Finish”
How to create Gantt chart
There are free or simple programs in which you can build a diagram in several stages. And there are specialized tools in which this can be done in a couple of clicks.
The choice of instrument depends on the scale and importance of the project. If you are making a diagram for your small project, you can use free solutions. Large companies working with expensive and complex projects should focus on professional programs, as this reduces time and improves the quality of project management.
Pencil and Paper
 Do not even think that using a piece of paper and a pencil won’t work for a Gantt chart. All the biggest projects on the planet were made with paper and a pencil: for example, the first car, the first plane, the first TV, the first computer, and so on. The Gantt chart is easily constructed with a regular pencil in a checkered school notebook, and it brings many benefits to a project.
MS Excel or Google Sheets or LibreOffice
 Or, any spreadsheet can be used. You can use the cells in the table to build your task list and arrange the columns with the execution time. You can just do it with your hands and a keyboard. And you can use the tools to fill in the cells and then generate a diagram in the table, which is also easy if you watch the video on how it is done.
Specialized tools (MS Projects, Open Project)
 Specialized tools allow you to do Gantt charts with your eyes closed. You click on the necessary buttons and learn the software intuitively. Despite the ease of these tools they allow you to manage large and complex hierarchical projects. There are specialized functions that allow you to rebuild the project on the go, make changes, calculate special indicators of the project, etc. so the specialized software is worth it. For instance, you can use Microsoft Projects or, if you prefer a cloud solution, there is an Open Project.
Critical path network diagrams
The disadvantage of the Gantt chart is that it does not show which tasks are “critical”; the Critical Path Method can be used successfully for this.
The critical path method is scheduling, planning, and project management tool. The critical path method was developed in the late 1950s by Morgan Walker of DuPont and James Kelley of Remington Rand. The method is based on the determination of the most lengthy task sequence from the beginning of the project to its completion, taking into account their interconnection. Tasks that lie on a critical path (critical tasks) have a zero reserve of execution time, and, in case of a change in their duration, the timing of the entire project changes. In this regard, critical tasks require more careful monitoring. In particular, attention must be paid to the timely identification of problems and risks affecting deadlines and, consequently, the timing of the project as a whole. In the course of the project, the critical path of the project may change.
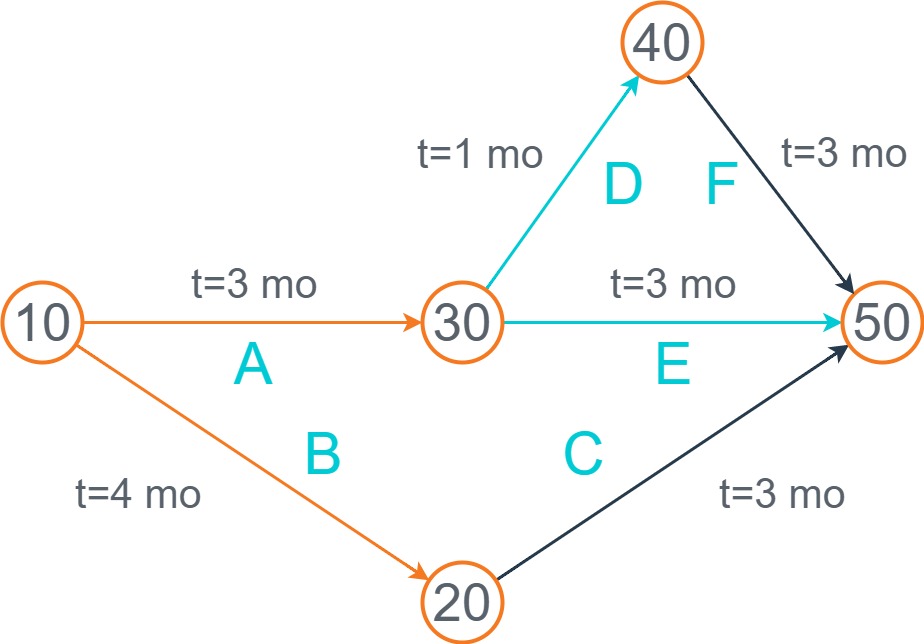
Fig. 6. PERT chart for a project with five milestones (10 through 50) and six activities (A through F)
Image source
If the initial moment of the project is set equal to zero, then the deadlines for the first tasks will be determined by their duration. The time of occurrence of any event should be set equal to the latest completion time of the tasks directly included in this event: it is assumed that the work in the network schedule cannot begin until all the previous work for it has been completed. The essence of solving the problem of reducing the time required on the network schedule is to attract additional resources to perform work that lies on a critical path, remove work that does not lie on a critical path, and parallel the work.
Then critical paths can be highlighted on the Gantt chart which helps project managers control the process carefully (Fig. 2).
Agile methodologies and Gantt chart
Now, some will say, why do we need these Gantt charts, they are as old as light, and we now have the latest Agile technology. Within the framework of a long-term project perspective, if you look forward to 2-3 iterations into Scrum, or, for example, you are planning tasks within one iteration, the Gantt chart creates a clear picture for you.
If you have tried to use Scrum technology to clearly track the connectedness of tasks in one iteration for 3-4 weeks you know how cloudy it can be. This requires increased concentration and attention to detail. If you have a Gantt chart before your eyes, and your team members will see it too, then you can build tasks in the backlog in such a way that the critical path is the way you plan it and exactly fits into one agile iteration.
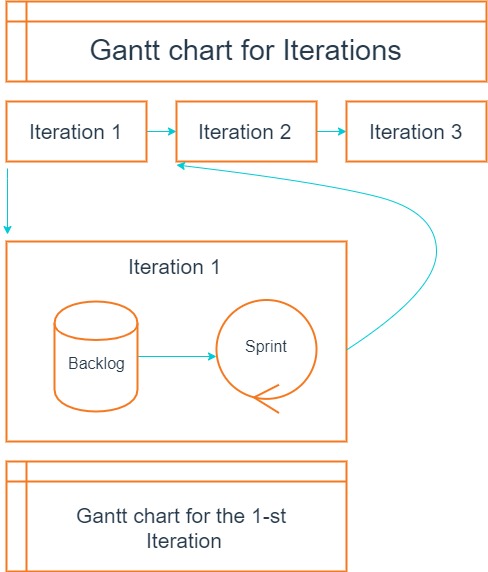
Fig. 7. Using Gantt Charts for Scrum
Stakeholders will also worry much less if they see a normally constructed Gantt chart and you note progress in completing tasks. Many will argue, well, there is a backlog, why overload yourself with the construction of additional graphs or charts. But this work will take you 10-20 minutes, and will be useful for hundreds and hundreds of working hours for your team.
Read this and this article to see how much the use of the Gantt diagram method in agile technologies helps and facilitates the life of all project participants - the stakeholders, the scrum master, the development team, the testers, etc.
The most interesting benefit of using the Gantt chart is when you become really agile on the project when for the next sprint or two you are trying to select the necessary features of your project. In planning, it is always easier to see everything in the form of charts so you can put exactly what you need in the next sprint and, most importantly, what you can really do on time.
On the Gantt chart, it is proven by experience that you will immediately see an error in planning and this will save a lot of time and money compared to the cancellation of the Scrum iteration.
Conclusion
In general, the best advice on this topic is the following. If you are not a “Jedi” who has worked in project management for 50 years or more, it is better to draw a Gantt chart, whether on a piece of paper, using a spreadsheet on a computer, or in specialized software. Usually, beginners think that everyone will be able to envision all details in their head, without using a Gantt chart, or some other method for documenting a project. But they are mistaken, as it is very difficult to keep all aspects of even a simple IT project in mind. Therefore, do not clutter your head with details, make use of this system. Believe that veteran project managers use this approach, even though they are very experienced and have a specially trained memory. When you write down everything and build a project plan, your life becomes much easier. Svitla wishes you clear Gantt charts and successful projects.