
Wpf application with real-time data in OxyPlot charts
This article is devoted to the Wpf application that shows (emulated) real-time data in charts. It could be used as base for monitoring application, when data service provide real data like, for example, number of http requests or CPU temperature. OxyPlot library is used for chart controls, as it is lightweight and easy to use.
Features
Application demonstrates the following features:
- data service provides (emulated) real-time data;
- chart repository parses data and provides latest data;
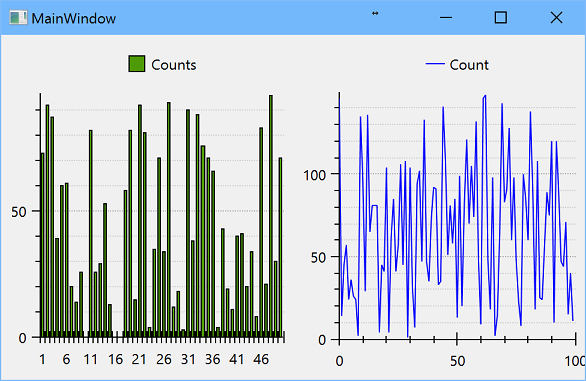
- data is shown in line and column charts;
- using of dependency container.
Background
Solution uses C#6, .Net 4.6.1, Wpf with MVVM pattern, NuGet packages Unity and Ikc5.TypeLibrary, and OxyPlot chart control. OxyPlot is added to project by NuGet packages OxyPlot core library (PCL) 1.0.0 and OxyPlot for WPF 1.0.0.
Solution
Solution contains one Wpf application project. The main part of the application is chart repository - the object that receives data from services, parses and provides it to consumers. Data service emulates data, but in real-world example it reads data from external source, and put it to repository. Data service is controlled by application, and there are several instances could be executed. User controls consume data from repository and update charts.
Chart repository
ChartRepository class implements IChartRepository interface:
public interface IChartRepository : INotifyPropertyChanged
{
  IReadOnlyList<int> LineCountList { get; }
  IReadOnlyList<int> ColumnCountList { get; }

  void AddLineCount(int newValue);
  void AddColumnCount(int index, int newValue);
}
Properties are used by consumers, that in this application are view models for user controls. LineCountListprovides one-dimensional series as values for some process. Repository keeps not great than 100 values. Data services use AddLineCount to add new value. ColumnCountList provides two-dimensional data like the set of pairs (index, value), and could be used as distribution of process values. Data services use AddColumnCount to add pair (index, new value).
The instance of repository should be singleton. Lifetime of this object is controlled by DI container. In addition, base interface INotifyPropertyChanged allows inform consumers that properties were changed and could be used in Wpf data binding mechanism.
Wpf application
Wpf application is done in MVVM pattern with one main window. Main window contains two user controls: ColumnChartView and LineChartView. Relatively, main window view model contains two properties with view models for child controls:
public interface IMainWindowViewModel
{
  ILineChartViewModel LineChartViewModel { get; }
  IColumnChartViewModel ColumnChartViewModel { get; }
}
and
<Grid>
    <Grid.ColumnDefinitions>
        <ColumnDefinition Width="*"/>
        <ColumnDefinition Width="*"/>
    </Grid.ColumnDefinitions>

    <ContentControl

        Grid.Column="0">
        <views:ColumnChartView

            DataContext="{Binding ColumnChartViewModel}"/>
    </ContentControl>

    <ContentControl

        Grid.Column="1">
        <views:LineChartView

            DataContext="{Binding LineChartViewModel}"/>
    </ContentControl>

</Grid>
ColumnChartViewModel gets chart repository as constructor parameter and transform ColumnCountListvalue to the list of Tuple objects:
public IReadOnlyList<Tuple<string, int>> CountList =>
  _chartRepository.ColumnCountList.
  Select((value, index) => new Tuple<string, int>(index.ToString("D"), value)).
  ToList();
Now it could be bound to OxyPlot chart controls:
<oxy:Plot

    x:Name="CountPlot"

    LegendPlacement="Outside"

    LegendPosition="TopCenter"

    LegendOrientation="Horizontal"

    LegendBorderThickness="0"

    PlotAreaBorderThickness="0"

    IsEnabled="False"

    Background="{DynamicResource {x:Static SystemColors.ControlBrushKey}}">

    <oxy:Plot.Axes>
        <!-- axes don't use binding-->
    </oxy:Plot.Axes>

    <oxy:Plot.Series>
        <oxy:ColumnSeries

            x:Name="CountSeries"

            Title="Counts"

            ItemsSource="{Binding CountList}"

            Color="Blue"

            StrokeThickness="1"

            ValueField="Item2"/>

    </oxy:Plot.Series>
</oxy:Plot>
Similarly, LineChartViewModel gets chart repository as constructor parameter and transform LineCountListvalue to the list of DataPoint objects:
public IReadOnlyList<DataPoint> CountList =>
  _chartRepository.LineCountList.Select((value, index) => new DataPoint(index, value)).ToList();
and
<oxy:Plot

    x:Name="CellCountPlot"

    LegendPlacement="Outside"

    LegendPosition="TopCenter"

    LegendOrientation="Horizontal"

    LegendBorderThickness="0"

    PlotAreaBorderThickness="0"

    IsEnabled="False"

    Background="{DynamicResource {x:Static SystemColors.ControlBrushKey}}">

    <oxy:Plot.Axes>
        <!-- axes don't use binding-->
    </oxy:Plot.Axes>

    <oxy:Plot.Series>
        <oxy:LineSeries

            x:Name="TotalSeries"

            Title="Count"

            ItemsSource="{Binding CountList}"

            DataFieldX="X"

            DataFieldY="Y"

            Color="Blue"

            StrokeThickness="1"/>

    </oxy:Plot.Series>
</oxy:Plot>
Data service
Data service could be described by IService interface. It's quite simple, and allows to start and to stop service execution:
public interface IService
{
  /// <summary>
  /// Start service.
  /// </summary>
  void OnStart();

  /// <summary>
  /// Stop service, cleanup data.
  /// </summary>
  void OnStop();
}
Service is started and stopped in application App class:
protected override void OnStartup(StartupEventArgs e)
{
  base.OnStartup(e);

  // container and other initialization
  // ...

  _chartService = container.Resolve<IService>();
  _chartService.OnStart();
}

protected override void OnExit(ExitEventArgs e)
{
  _chartService.OnStop();
  base.OnExit(e);
}
Data service is implemented by ChartService class. It inherits IService interface, and uses DispatcherTimer object and, when it ticks, emulates data by using random generators:
private readonly IChartRepository _chartRepository;

public ChartService(IChartRepository chartRepository)
{
  chartRepository.ThrowIfNull(nameof(chartRepository));
  _chartRepository = chartRepository;

  _countTimer = new DispatcherTimer
  {
    Interval = TimeSpan.FromMilliseconds(250),
    IsEnabled = false
  };
  _countTimer.Tick += CountTimerTick;
}

/// <summary>
/// Method emulates new data.
/// </summary>
/// <param name="sender"></param>
/// <param name="e"></param>
private void CountTimerTick(object sender, EventArgs e)
{
  var value = _countRandom.Next(150);
  _chartRepository.AddLineCount(value);

  var index = _indexRandom.Next(50);
  value = _countRandom.Next(100);
  _chartRepository.AddColumnCount(index, value);

  _countTimer.Start();
}
As data is emulated in timer' tick method, start and stop methods are correspond to start/stop methods of the timer:
/// <summary>
/// Start process.
/// </summary>
public void OnStart()
{
  _countTimer.Start();
}

/// <summary>
/// Stop process, cleanup data.
/// </summary>
public void OnStop()
{
  _countTimer.Stop();
}
Dependency container
Unity is used as dependency container. As was mentioned above, main window view model keeps view models for child controls, and these properties are expected to be resolved via dependency injection. So, at first we need register necessary types for view models, chart repository and service in dependency injection container. In Wpf applications the initialization of DI container is done in OnStartup method in App.xaml.cs:
protected override void OnStartup(StartupEventArgs e)
{
  base.OnStartup(e);

  IUnityContainer container = new UnityContainer();

  container.RegisterType<ILogger, EmptyLogger>();
  container.RegisterType<IChartRepository, ChartRepository>(new ContainerControlledLifetimeManager());
  container.RegisterType<IService, ChartService>(new ContainerControlledLifetimeManager());
  container.RegisterType<IMainWindowViewModel, MainWindowViewModel>();
  container.RegisterType<IColumnChartViewModel, ColumnChartViewModel>();
  container.RegisterType<ILineChartViewModel, LineChartViewModel>();

  var mainWindow = container.Resolve<MainWindow>();
  Application.Current.MainWindow = mainWindow;
  Application.Current.MainWindow.Show();

  // other initialization
  // ...
}
In MainWindowViewModel class Dependency attribute is used. It informs container to resolve these properites during object's resolv process:
public class MainWindowViewModel : IMainWindowViewModel
{
  [Dependency]
  public ILineChartViewModel LineChartViewModel { get; set; }

  [Dependency]
  public IColumnChartViewModel ColumnChartViewModel { get; set;  }
}

CTO and Senior Cloud Architect
Related articles


Let's discuss your project
We look forward to learning more and consulting you about your product idea or helping you find the right solution for an existing project.
Your message is received. Svitla's sales manager of your region will contact you to discuss how we could be helpful.
