
Modern web applications are highly loaded systems, often with hundreds of thousands of concurrent users. Web pages become critical, handling many sessions of potential users or customers. As such, even the smallest change like background color, the positioning of the “Buy” button, font size, or the product’s price, have a significant impact on the number of sales and user loyalty to the product. It’s virtually impossible to guess at first glance what set of choices will be more pleasing for end users. For this reason, it’s essential to conduct research for specific target groups, allowing clients the opportunity to try different versions of a website and provide their feedback. This method is commonly known as A/B testing.
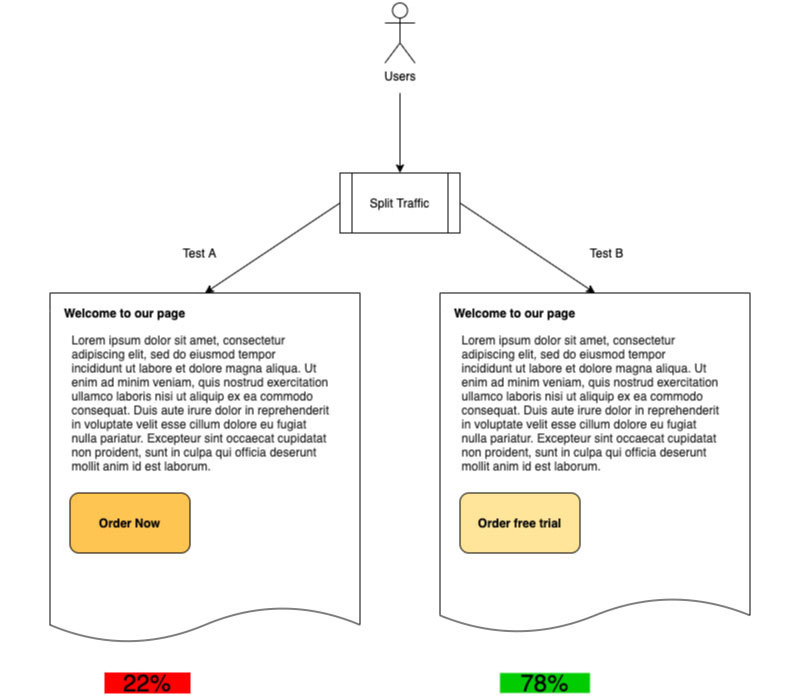
In its simplest form, A/B testing is a technique used for experiments where split testing is based on randomly showing different page versions to users and evaluating what works best. Be it a web application, screens, a mobile application, or any other type of system that involves user interaction, A/B testing goes a long way in providing actionable insights through comprehensive feedback. In an A/B experiment, you show parts of the audience one version of the page or its controls; to another audience, you show a different version of the page or its controls. After that, you look at which version positively influences the business metrics of your system. While it may look like an idea as simple as this one could not greatly affect the parameters of a system and business indicators, A/B testing has grown to be nearly indispensable for those seeking to improve applications realistically. It’s an effective approach that gives you important results.
What is A/B Testing?
We’d like to kick off our narrative with a definition of A/B testing to help you grow even more acquainted with the term. A/B testing is first and foremost a user experience research methodology that deals with user feedback and a dynamic component. Overall, it’s the process of comparing two or more variations of a particular page element or control, where business processes and metrics are the governing components for the optimal performance of specific goals.
After careful observation, A/B testing results help determine which of the options yielded the best results and is more effective, by testing the response of users to a set of options and comparing them to glean insights that will lead to metric improvements. Moreover, tech giant Microsoft states that “A/B testing is an industry-standard method for determining the user impact of a potential change in a technology stack. It involves randomizing user traffic to a product between two experiences, computing the difference in metrics, and running statistical tests to rule out any differences due to noise. Randomization is done against an identifier (called the “randomization unit”) and the experiences are called treatments (so the experience a user is in is often called “treatment assignment”). We perform statistical tests to determine the treatment effect on the product. Analysis can then be split by different identifying information (segments) or can be examined by zooming in to data that meets a certain condition relevant to the experience being tested (this is called “triggering“). A common problem at Microsoft is how to perform an A/B test on one product, but measure the impact of that test on another product.”
So, when should you resort to A/B testing? We round up the most common scenarios:
- In the presence of sensitive spots for the user;
- When the target audience displays unstable behavior inside the system;
- When there’s a need to increase the number of conversions or leads:
- When you need to help reduce the bounce rate;
- In the deployment of a critical, new functionality.
Common types of A/B tests
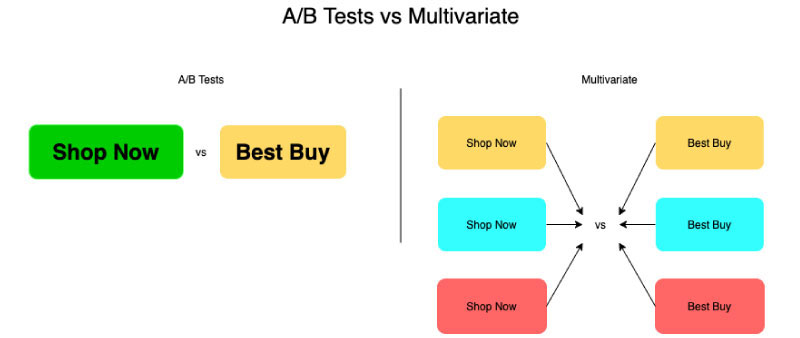
A/B testing typically splits audiences between two or more different versions of an application. There are two main A/B testing types: split tests where you compare two variants of an application and multivariate tests where several combinations of one or more key page elements are compared to one another. The latter is particularly helpful in figuring out which of the combinations is best for a specific scenario, and as a result, for the overall business process. While relatively complex to conduct, multidimensional A/B testing has a number of key advantages that you should consider:
- Mitigate the need to run multiple, consecutive A/B tests, helping save time and money;
- Analyze the contribution of each element in the page to glean greater insights from measurable business metrics;
- Evaluate, measure, and compare all interactions between different element variations on an application.
Main Tasks A/B Testing Helps Solve
Eliminate user pain points when working with an application
Application users visit your site or mobile app for a specific reason, they want to achieve a goal. Regardless of their purpose, users may find themselves in common pain points with your system that can range from the wrong color scheme for a page, misplaced controls, the absence of Call to Action (CTA) elements, etcetera. There are a number of behavior factors that should be assessed to evaluate the interest of users in your system. Some of these key metrics include:
- page view depth, meaning the number of viewed pages related to the number of visitors on the site;
- the average session duration;
- the bounce rate, or the so-called proportion of users who left the site immediately after the first visit;
- the retention rate, which can be considered as the decrease of the percentage of new users.
You can collect user data to take a granular look at user behavior with tools like Google Analytics, heat maps, tracking systems, and many others. By leveraging any of these tools, you can help eliminate major bottlenecks in your system’s pages, which in turn will significantly increase business metrics. You can fully automate the testing process with tools like Google Optimize, Optimizely, and hundreds of other similar services.
Reduce the failure rate of the information system
As an application owner, bounce rate is one of the most important parameters for you. When it comes to Google Analytics, a failure is a session in which the user sent only one request to the system. If the user did not show further activity after than one system request, this increases the bounce rate. The bounce rate index is calculated as the ratio of the number of bounces to the total number of site visits. Users can simply leave the application after visiting a single page, harming not only the site’s statistics, but also your brand’s image and reputation. Most users refuse to continue their exploration of the application for very simple reasons, and in some cases, the reasoning behind is not so visible, prompting you to dig much deeper. For example, numerous bounces may signal the presence of inaccurate information or a poor-quality CTA. If users leave your application, the company is subjected to important conversion losses.
In this case, A/B tests help evaluate how well CTAs are positioned in the landing page and how well they are performing under different circumstances. If the quality of the CTA and its effectiveness is too low, your page’s productivity will be hindered. To help reduce the bounce rate with a high percentage of this index, marketers typically conduct volumes of A/B testing exercises. For example, to achieve effective testing, the site should receive approximately 1,000 visits, and after that, draw preliminary conclusions. Otherwise, available data becomes insufficient, making you resort to complex probable estimation methods. After performing the necessary work with CTAs or page elements, you will feel more comfortable in concluding which of the options you presented showed the most favorable results. As a follow-up, you should then make a decision to change elements on your application to achieve the desired outputs.
Make low-risk changes in new releases
When deploying a new page design for your system can lead to a growing number of risks that may lead to a decrease in conversion rates. You can gradually make changes, step by step, and track via A/B testing how users are perceiving and responding to changes. Otherwise, you can set up A/B testing so 5-10% of users see the new page design, so you can compare whether the new page leads to an improvement in your preferred indicators. With results in hand, you can gradually transfer users to the new page design completely. A/B testing enables you to target your resources for maximum results with minimal change. In turn, this leads to an increase in Return on Investment (ROI). For example, you may have different product description options. If you delete or update the product description, you can run an A/B test to see how that performs. That way, you can understand more about how your users will react to changes, and take action based on that data.
In addition, an example of low-level risk change is the introduction of a new feature. Before introducing a new feature, A/B testing can help test a specific percentage of your audience to figure out if the change will be well received. Thus, you can make data-driven adjustments and expand the audience, so more users can try out the feature. Overall, A/B testing provides better results and helps you avoid the risks associated with releasing a new feature.
A Statistical Approach to A/B Testing
There are two types of statistical approaches used by A/B/n experimenters around the world: Frequentist and Bayesian.
- A frequency-based probabilistic approach determines the likelihood of an event based on how often a particular event occurs across a relatively large number of trials or data points. In this approach, more data is needed for A/B testing as you will be testing more visitors for longer periods of time, giving you more accurate conclusions. According to the Frequentist's approach, it’s important to feel the required duration of your A/B test based on the sample size.
- Bayesian statistics is a theoretical approach that deals with the Bayesian interpretation of probability, where probability is expressed as the degree of belief in an event. The more information you accumulate about an event, the better and faster you can predict the final result. According to Bayesian statistics, the probability is not a fixed value; it can change as new information is collected.
Frequency-based statistics correspond to the definition of probability “Probability as long-term frequency.” Whereas Bayesian statistics adheres to the concepts of "logical probability." The Frequentist approach usually requires the test to run for a set period in order to get the correct data out of it. Here, you can’t tell how close or far A and B actually are. It cannot tell you the probability that A will beat B, or vice versa, at the end of the experiment. The Bayesian approach, in turn, gives you more control over your testing. It enables better planning, more accurate indicators for test completion, and a deeper dive into the details of how close or far A and B are.
Conclusion
A/B testing is a powerful marketing tool to improve the performance of your website. Using A/B tests increases the conversion of landing pages, selects the optimal ad titles in ad networks, and improves search quality for potential users. If you need to perform A/B testing, you can contact Svitla Systems for qualified assistance. Our experts will calculate the necessary set of options for split testing and ensure the proper collection of information based on test results.
Svitla Systems uses smart technologies to conduct A/B testing regardless of project complexity. Our developers can conduct both A/B testing and multivariate testing for your websites and mobile applications. Svitla Systems developers are experienced in different frameworks, helping you identify and solve your user’s problems, reduce the number of errors when deploying new functionality, and significantly improve business performance, which depends on the implementation of the front-end part and the logic of your system.