
Pandas is a Python data manipulation library that simplifies data processing across many IT sectors and roles, including analysts, data scientists, ETL engineers, and more, to read, process, and write data. Moreover, as it usually happens with Python, all actions can be written in 1-2 lines. In addition, with how short code is, the Pandas library provides very convenient and understandable data processing mechanisms. The main Pandas data structures are series and dataframes; here, we’ll review how the Pandas library tools can help you in your data management and data analysis endeavors. Let’s get started!
What are data management and data analysis?
Generally speaking, data management is a process associated with creating, changing, and deleting data, along with organizing its storage and retrieval. Data management processes can be divided into the following components:
- Data analysis
- Data architecture
- Data mining
- Data protection
- Extracting, transforming and loading data
- Data modeling
- Data quality assurance
- Working with data warehouses
- Database management
- Metadata management (data repositories)
- Data encryption
As a whole, the process of data management involves the collection, storage, processing and the interpretation of accumulated data. Nowadays, for many companies, data management is an excellent opportunity to understand the data that has already been collected, “learn” from competitors, build predictive analytics (forecasting), and support decision-making activities.
Database management consists of the following stages:
- ETL processes (extraction, transformation and loading of data);
- Data collection;
- Data protection and encryption;
- Data modeling;
- Data analysis itself.
Among the most common mistakes and concerns that arise when collecting, storing, and interpreting data, we can find:
- Incomplete data;
- "Duplication" of data (and often contradicting data);
- Outdated data.
A data analysis solution consists of three main blocks:
- Data store;
- ETL procedures (data extraction, transformation and loading);
- Reporting and visual analytics system.
In many of these processes, the Pandas library is a convenient and fast toolkit for solving both global and local data processing and analytics tasks.
Why do we need the Pandas library?
As mentioned on the developers website: “Pandas is a fast, powerful, flexible and easy to use open source data analysis and manipulation tool, built on top of the Python programming language.” The Pandas library comes with the following highlights:
- A fast and efficient DataFrame object for data manipulation with integrated indexing;
- Tools for reading and writing data between in-memory data structures and different formats: CSV and text files, Microsoft Excel, SQL databases, and the fast HDF5 format;
- Intelligent data alignment and integrated handling of missing data: gain automatic label-based alignment in computations and easily manipulate messy data into an orderly form;
- Flexible reshaping and pivoting of data sets;
- Intelligent label-based slicing, fancy indexing, and subsetting of large data sets;
- Columns can be inserted and deleted from data structures for size mutability;
- Aggregating or transforming data with a powerful “group by” engine allowing split-apply-combine operations on data sets;
- High performance merging and joining of data sets;
- Hierarchical axis indexing provides an intuitive way of working with high-dimensional data in a lower-dimensional data structure;
- Time series-functionality: date range generation and frequency conversion, moving window statistics, date shifting and lagging. Create domain-specific time offsets and join time series without losing data;
- Highly optimized for performance, with critical code paths written in Cython or C.
- Python with Pandas is in use in a wide variety of academic and commercial domains, including Finance, Neuroscience, Economics, Statistics, Advertising, Web Analytics, and more.
Series
Series is a one-dimensional labeled array capable of holding any data type (integers, strings, floating point numbers, Python objects, etc.) The axis labels are collectively referred to as the index. The basic method to create a Series is to call:
>>> s = pd.Series(data, index=index)
Here, data can be many things:
- a Python dict;
- a ndarray;
- a scalar value (like 5 or 7, etc.).
The passed index is a list of axis labels.
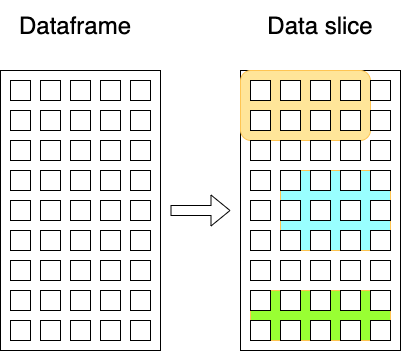
DataFrame
DataFrame is a 2-dimensional labeled data structure with columns of potentially different types. You can think of it like a spreadsheet or SQL table, or a dict of Series objects. It is generally the most commonly used Pandas object. Like Series, DataFrame accepts different kinds of inputs:
- Dict of 1D ndarrays, lists, dicts, or Series;
- 2-D numpy.ndarray;
- Structured or record ndarray;
- A Series;
- Another DataFrame.
Along with data, you can optionally pass index (row labels) and columns (column labels) arguments. If you pass an index and/or columns, you are guaranteeing the index and/or columns of the resulting DataFrame. Thus, a dict of Series plus a specific index will discard all data not matching up to the passed index.
Input-output
The most valuable feature in the Pandas library is the functionality to read and write data from various formats. The list of options is really big and comprehensive: Flat file, Excel, JSON, HTML, HDFStore: PyTables (HDF5), Feather, Parquet, ORC, SAS, SPSS, SQL, Google BigQuery, STATA.
Grouping in Pandas
Grouping data is one of the most commonly used methods in data analysis. In Pandas, the .groupby method is responsible for grouping. For more information, please refer to this great tutorial on the Pandas website.
Pivot tables in Pandas
The term "pivot table" is well known to those who are familiar with the Microsoft Excel tool or any means that are designed to process and analyze data. In Pandas, pivot tables are built through the .pivot_table method. For more information, please refer to this great tutorial on the Pandas website.
Aggregation in Pandas
Once the GroupBy object has been created, several methods are available to perform a computation on the grouped data. These operations are similar to the aggregating API, window API, and resample API. Aggregation is available for dataframes and series. Please find more information in the Pandas documentation:
- for dataframes
- for a series
Data visualization in Pandas
For visual analysis of data, Pandas uses the matplotlib library. It is really easy to visualise andy dataframe or data slice in Pandas:
ts = pd.Series(np.random.randn(1000), index=pd.date_range("1/1/2000", periods=1000))
ts = ts.cumsum()
ts.plot();
Code language: JavaScript (javascript)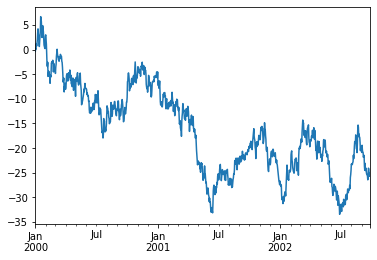
Another example of using matplot for dataframe:
speed = [0.1, 17.5, 40, 48, 52, 69, 88]
lifespan = [2, 8, 70, 1.5, 25, 12, 28]
index = ['snail', 'pig', 'elephant',
         'rabbit', 'giraffe', 'coyote', 'horse']
df = pd.DataFrame({'speed': speed,
                   'lifespan': lifespan}, index=index)
ax = df.plot.bar(rot=0)
Code language: JavaScript (javascript)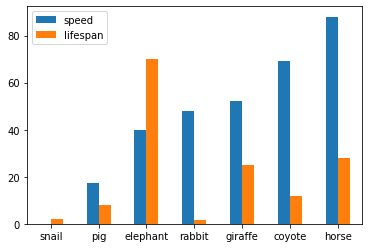
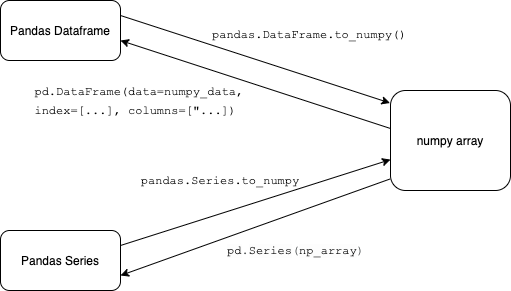
Pandas and NumPy
In practice, when solving Data Science and Machine Learning problems, you have to work the same way with the NumPy library because it allows you to quickly and easily process large amounts of data. The NumPy library provides the ability to work with multidimensional arrays and is based on the ndarray class, represented as a multidimensional container of elements of the same data type and size. To integrate with NumPy, the Pandas library primarily uses the pandas.DataFrame.to_numpy and pandas.Series.to_numpy methods. This allows you to convert a Pandas dataframe and series to a NumPy array. The NumPy library provides objects for multidimensional arrays, while the Pandas library offers an in-memory 2d table object called Dataframe. NumPy consumes less memory when compared to Pandas because it uses ndarray class, and it is smaller when compared to the Dataframe. As mentioned across many online resources, “Pandas has a better performance when the number of rows is 500K or more. Numpy has better performance when the number of rows is 50K or less.” From experience of data analytics at Svitla Systems, both Pandas and NumPy are helpful instruments for specific tasks. It is great to combine their functionality and use the best methods from these two libraries.
Example of data analysis with Pandas
To install the Pandas library, use pip3:
pip3 install pandasTo import Pandas from Python, you can use “import pandas as pd”. The following example with the Panda library shows you how to:
- Read the data from a file and create a dataframe
- Calculate min, max and mean value for a given column by function calc_minmaxmean()
- Calculate nonzero elements in every column by using the function calc_nonzero()
- Calculate unique data in columns.
import sys
import pandas as pd
import numpy as np

def calc_nonzero(name):
   data[name] = data[name].fillna(0)
   column = data.loc[:, name]
   print("Nonzero " + name + " ", np.count_nonzero(column), " of ", len(column), " candidates")
   return (np.count_nonzero(column))

def calc_minmaxmean(name):
   column = data.loc[:, name]
   print("Min  " + name + " ", column.min())
   print("Max  " + name + " ", column.max())
   print("Mean " + name + " ", column.mean())
   return (column.min(), column.max(), column.mean())

if __name__ == "__main__":
   if len(sys.argv) > 1:
       print(f"Input File: {sys.argv[1]}")
   else:
       print("Add input file name in command line")
       exit(1)

   pd.set_option('display.max_rows', None)
   pd.set_option('display.max_columns', None)

   # import file by panda
   data = pd.read_csv(sys.argv[1])

   col_names = ['position', 'salary', 'education', 'portfolio']

   res = []
   # iterate through all columns
   for i in col_names:
       res = res + [calc_nonzero(i)]

   frame = pd.DataFrame({'Parameter':col_names, 'Value':res})
   frame.to_csv('outfilename.csv', index=False)

   print(f"Unique statuses in 'position' are {data.position.unique()}")
   print(data.position.value_counts())

   calc_minmaxmean('salary')
   calc_minmaxmean('education')
Code language: PHP (php)
The output will look something like this, depending on your data file:
Input File: test.csv
Nonzero position  14  of  33  candidates
Nonzero salary  11  of  33  candidates
Nonzero education  6  of  33  candidates
Nonzero portfolio  4  of  33  candidates
Unique statuses in 'position' are ['Product Manager' 'Sales manager' 'CTO' ...]
Product Manager 5
Sales manager	  3
CTO             3
…
Name: position, dtype: int64
Min  salary  0.0
Max  salary  200000.0
Mean salary  70628.278106508875
Code language: JavaScript (javascript)
Conclusion
From experience gained by working on diverse projects at Svitla Systems, the Pandas library is an almost indispensable tool when it comes to data processing and data analysis. The rapid development of scripts, sufficient speed for data processing, the ability to read different file formats, and more, are great advantages that help propel the development of modern information systems. In addition, the Pandas library is compatible with other libraries like NumPy, SciPy, and Matplotlib.
Svitla Systems highly qualified specialists have been working in the field of data processing and analysis for over 10 years and offer extensive expertise when it comes to quality software. In terms of speed and quality, Svitla Systems specialists provide unparalleled assistance and perform complex, science-intensive tasks with ease and flexibility. For solution-focused software development, you can leverage one of our outsourcing or team extension models; simply contact our representatives, and we’ll be happy to start putting your projects into high gear.