According to Standish Group research, 31.1% of projects will be canceled before they ever get completed. Further results indicate 52.7% of projects will cost 189% of their original estimates.
To complete the project on time and budget that were initially estimated, a thorough analysis should be made before the project starts. Let’s consider what stages are usually passed during the estimation.
Stage 1 – Gathering of Information
In the first stage, we need to analyze all materials received from the customer. In some cases, the customer provides detailed specifications, in other cases, only brief requirements for the project.
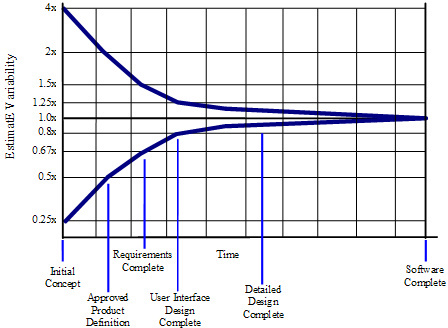
It should go without saying that the more information we have at the beginning the more accurate estimation of the project we get. This can be better displayed with such popular notion as the “Cone of Uncertainty” (described in the book “Software Cost Estimation with Cocomo II”) which shows that the estimations become more accurate as far as the project comes to its end (pic.1).

Picture 1 – Cone of Uncertainty
As the starting point, we create a Mind diagram that allows us to see the interconnections of all available project data and identify possible “bottlenecks” (pic.2). Analysis of such diagram results in forming a pool of clarifying questions to the customer.
Picture 2 – MindMap Diagram
Stage 2 – Creating Helping Diagrams
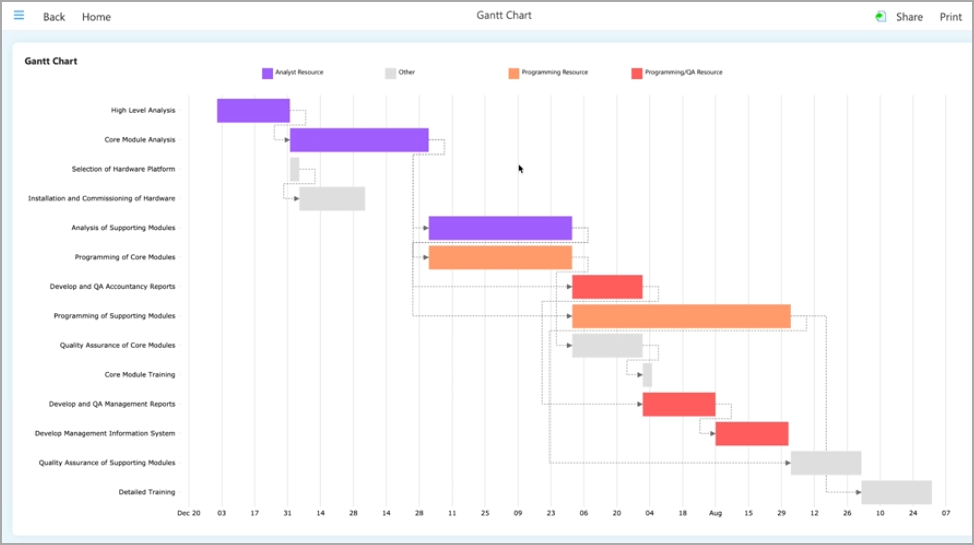
In case we receive the specification from the customer or get answers to our questions on the project requirements, or have a more detailed description of the project's stages, we can then build a more accurate Mind diagram (pic.3) with all interconnections that will help us create a Gantt diagram of the project.
The Gantt diagram shows not only project tasks and their relations but also the time supposed to complete them. To build a Gantt diagram we usually use estimation on the analogy, because the mathematical models in the case of project estimation are as a rule irrelevant or impossible. For convenience, we make a decomposition of each task, obtain interim estimations, take account of risks, and hence have a more precise Mind diagram. However, this technique has a limitation – it is badly applicable to new industries.
The interconnections on the Mind diagram set the time priorities of tasks. The same interconnections are then transferred to the Gant diagram (pic.3). If some task was shifted in time, this may influence the timing of the rest of the tasks or will make their execution impossible.

Picture 3 – Gantt Diagram
Thus, using Mind and Gant diagrams as helping tools we are able to estimate time for project development and identify the bottlenecks. Of course, the project time can be reduced, in some cases, by different ways:
- Using more team members in the project. However, according to the research conducted by Tom DeMarco in his book The Deadline, team augmentation does not always lead to good results. The research states that there is a critical number of members when each additional team member will only make worse to the project process.
- Paralleling of tasks. In case when the co-dependence of different tasks is weak, it is possible to work on them simultaneously in separate teams (for example, work on web site and native iOS application).
Stage 3 – Final Estimation
To get the final estimation it is necessary to create a table where all terms of project tasks, testing time, budget, and risks should be taken into account.
Conclusion
To sum up all the above-mentioned information, we can say that project estimation makes the basic stage of any IT project. Any overestimation or underestimation negatively affects the project, budget, and other indexes and relationships with the potential customer. Working on an IT project estimation, we try to take into consideration multiple factors in task creation. For this purpose, we widely use mind diagrams that help to understand requirements and find bottlenecks.


