
IT systems are increasingly becoming larger and larger with more users needing continuous improvements of service fault tolerance and quality service. There is a growing need to quickly identify deviations in data, track thousands of parameters for a large number of devices, as is the case of the Internet of Things (IoT), collect data from millions of devices every hour.
It’s safe to say that it’s very challenging to track the size of these volumes of information using logs or in text format and to top it off, it requires a lot of human effort.
Cue data visualization systems as the heroes in this narrative! Data visualization systems can visually display data from different sources to show what is happening with the parameters of the monitored technical part.
For this piece, we are going to focus on the Grafana data visualization system, so buckle up, and let’s get started!
Why use a web interface for Time Series Database?
The popular Time Series data storage method requires special databases to efficiently process large amounts of information.
The Time Series Databases covered in this article do the best job of storing and handling multiple parameter streams. In addition, they also have the ability to perform push and pull from various sources of information.
The Time Series Database itself is not capable of visualizing information that is stored in it. That’s where data visualization tools like Grafana come in. Time Series Databases like Prometheus, when paired with a tool like Grafana, works in concert to quickly configure the display of the necessary monitoring parameters in your existing out-of-the-box system.
At the same time, graphs and dynamic interaction with them are available in the form of a web interface, which makes it convenient to display a large amount of visual data on any device with a browser.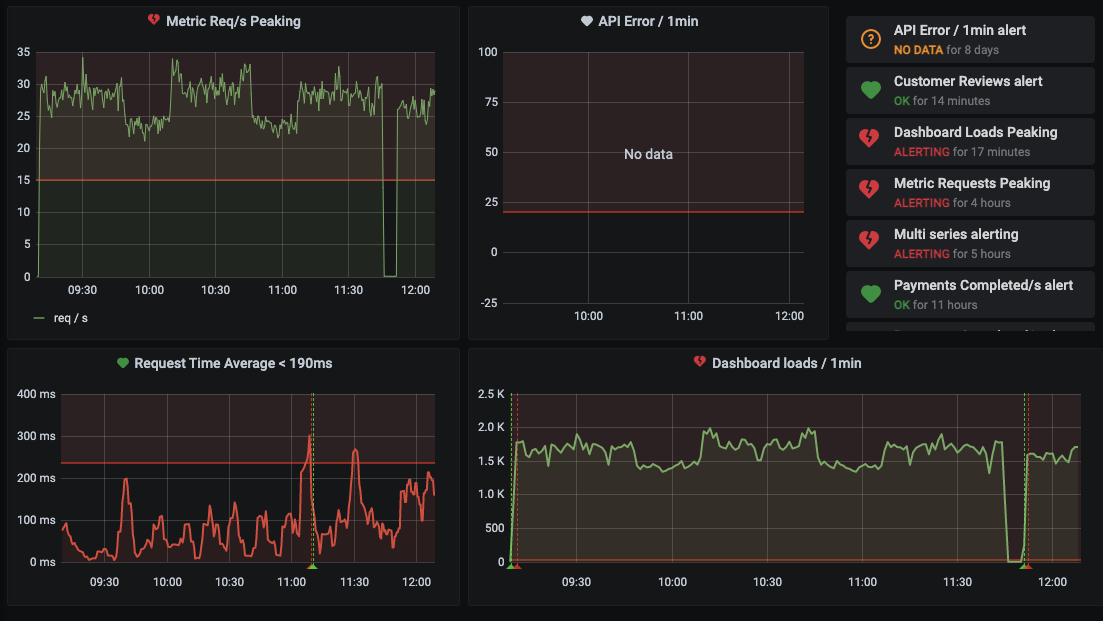
Terms and Components of Grafana
Grafana is an open-source platform for data visualization, monitoring, and analysis. Grafana allows you to create dashboards each displaying specific metrics over a set period of time. Each dashboard is versatile, so it can be customized for a specific project or any development and/or business needs.
The main Grafana terms allow you to operate the following categories of information to display:
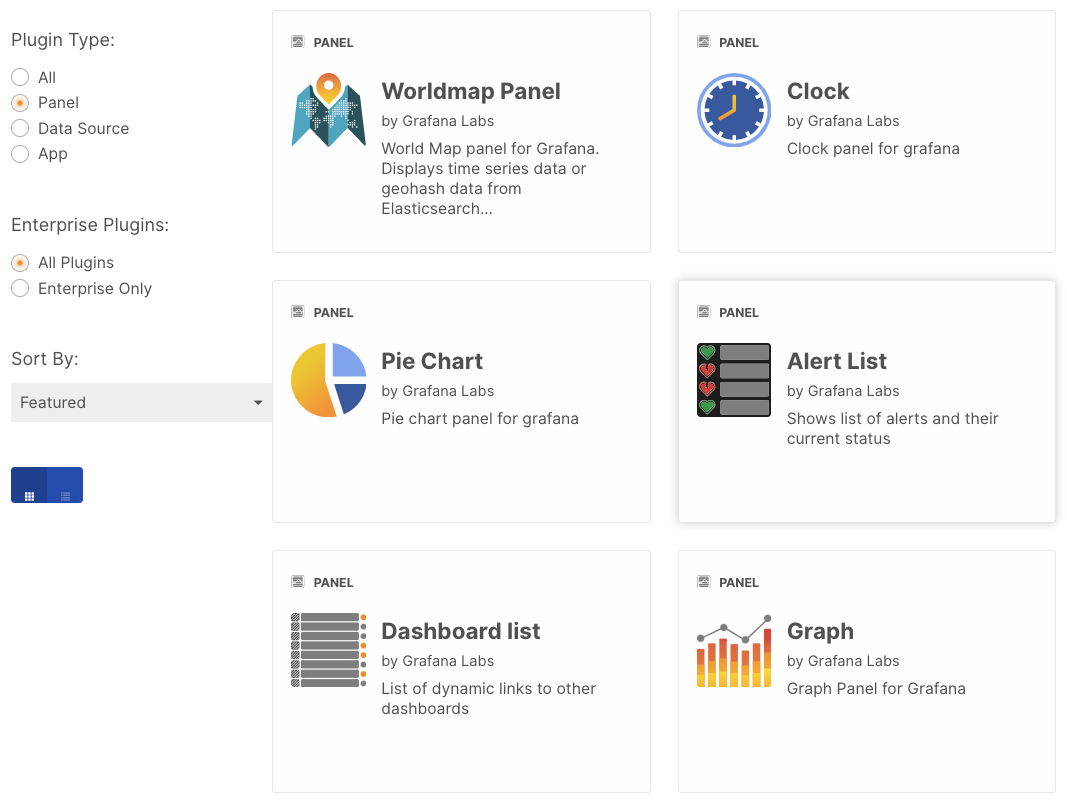
- The panel is the basic element of visualization of the selected indicators. Grafana supports panels with graphs, single statuses, tables, click heatmaps, and free text, as well as integration with official and community-created plugins (such as a world map or clock) and apps that can also be rendered. You can customize the style and format of each panel; all panels can be dragged to a new location, rebuilt, and resized.
- The dashboard is a set of individual panels placed in a grid with a set of variables (for example, the name of the server, application, and sensor). By changing the variables, you can switch the data displayed on the dashboard (for example, data from two separate servers). All dashboards can be customized and the data presented in them can be partitioned and fragmented according to the needs of the user. The Grafana project has a large community of code developers and users, so there is a large selection of ready-made dashboards for different types of data and sources.
- In dashboards, you can use annotations to display specific events in different panels. Annotations are added by custom queries, for instance, to Elasticsearch; the annotation is displayed as a vertical color line on the graph. When you hover over the annotation, it is possible to get event descriptions and tags, for example, to track a server response with an error code or to get another parameter of the system. This allows you to easily correlate time, a specific event, and its consequences in the application and investigate the behavior of the system.
The Grafana system has a wide range of options for installing additional plugins. These add-on modules fall into three categories:
- Panel
- Data Source
- Application
Grafana connection with different data sources
Built-in Graphite Support provides different sources for getting data and easy integration with existing software systems. As mentioned on the Grafana website, here's a step by step run-through on each data source:
- Grafana includes a built-in Graphite query parser that takes writing graphite metric expressions to a whole new level.
- Quickly add functions (search, typeahead)
- Click on any metric segment or a function parameter to change it
- Move function order to the left or right
- Direct to Graphite function documentation
- Rich templating support
Built-in InfluxDB Support
- Query editor with measurement, tag, and tag value completion
- Automatic handling of the group by time
- Templating queries for generic dashboards
- Ad hoc filters for exploration dashboards
Built-in Prometheus Support
- Query editor with metric name lookup
- Templating queries for generic dashboards
- Alias patterns for short readable series names
Built-in Elasticsearch Support
- Query editor with automatic property name lookup
- Extract many types of metrics from documents like Avg, Min, Max, Percentiles, Std Dev, etc.
- Group by multiple terms or filters
- Query only relevant indices based on time pattern
Built-in Cloudwatch Support
- Rich editor with auto-completion for metric names, namespaces, and dimensions
- Templating queries for generic dashboards
- Alias patterns for short readable series names
Data source plugins from the repository or build your own plugin with this tutorial.
Several plugins are available for free on the Grafana website: 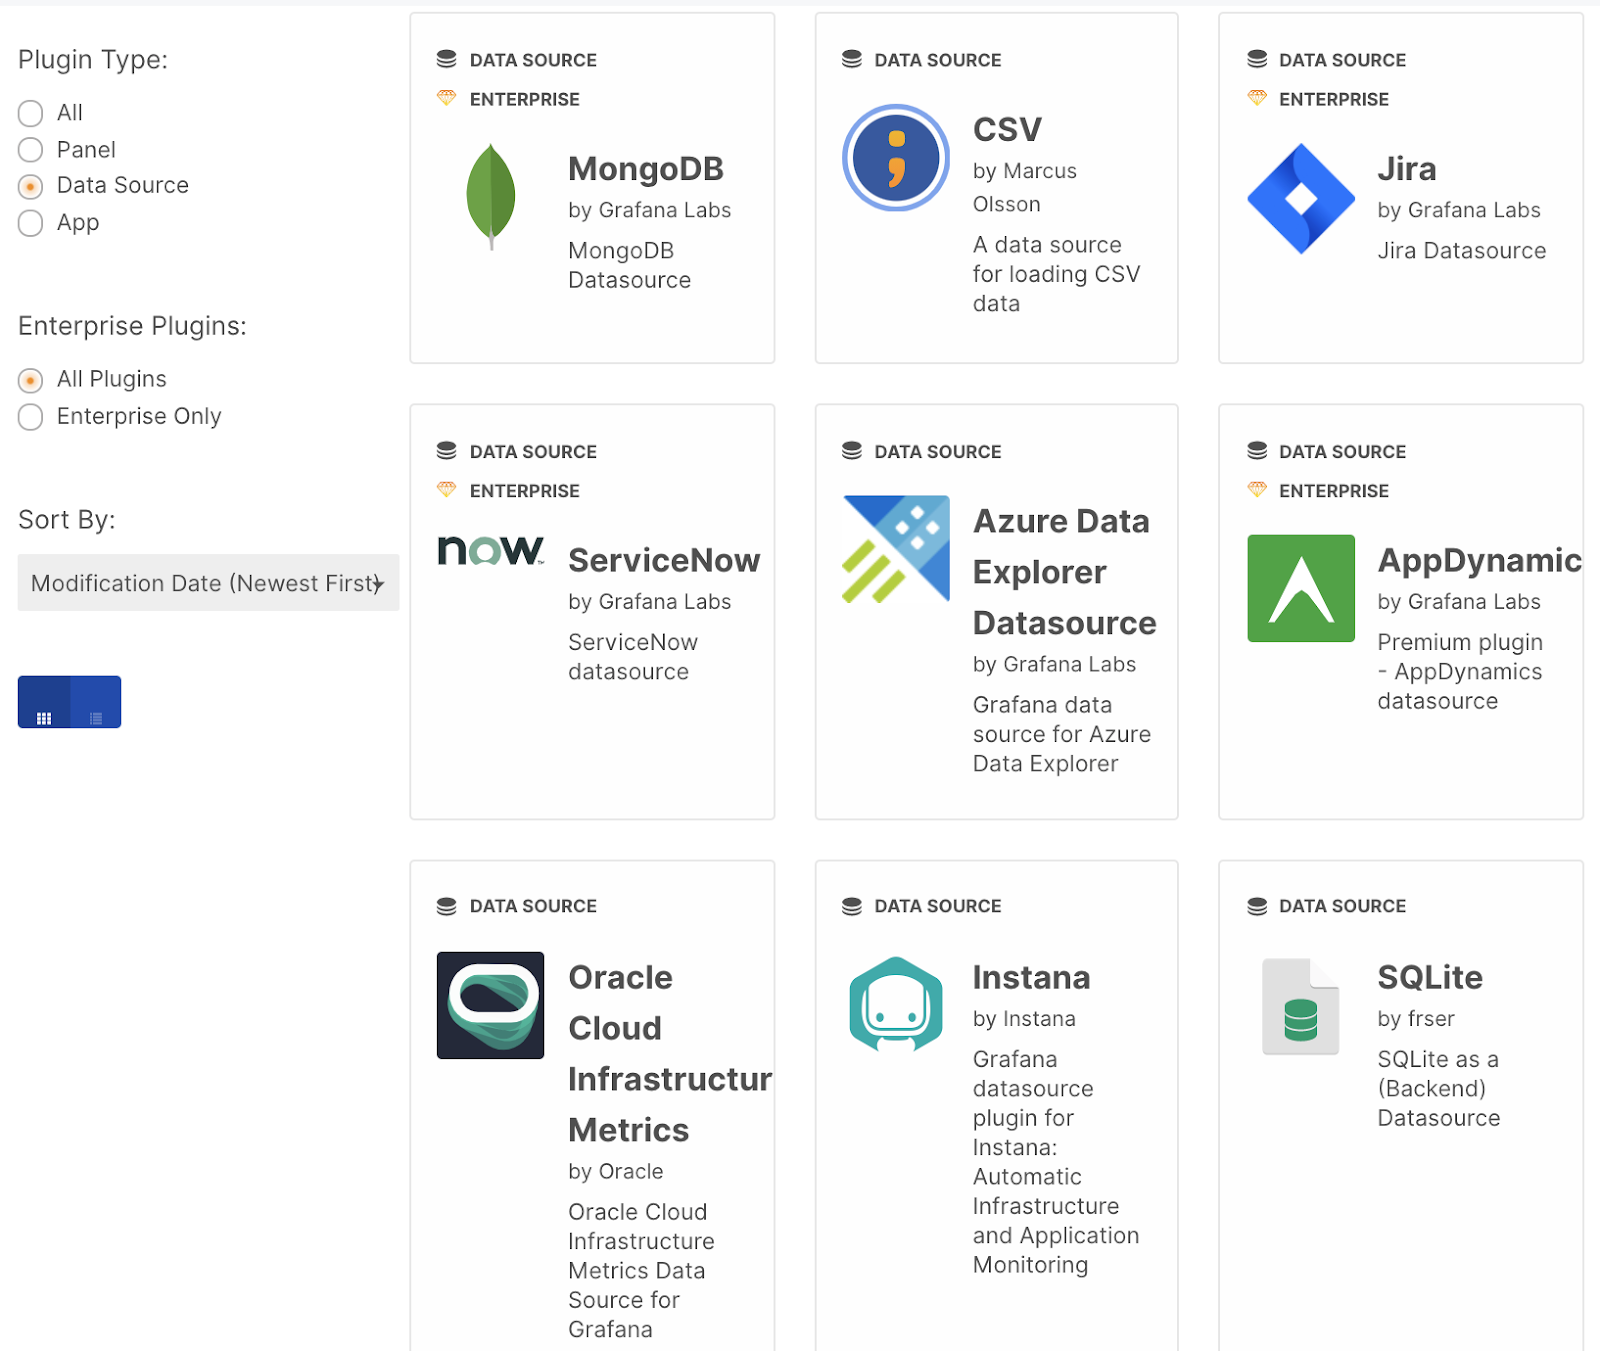
Visualization metrics in Grafana for a web application
Unlike working with plain text logs or reporting errors, Grafana provides tools for visualizing data in the form of graphs, charts, and tables. For example, you can collect data from a monitoring system that needs to be tracked for each processed request and response of an application software product.
The data can include the "success" / "failure" status and also a set of structured, general, and custom fields, for instance:
- application version and unique identifier for each request
- response time and status
- error code, if any
- IP address from which the request was sent
- user information, profile, user group
- type of IoT device and so on
The various metrics can be represented in different forms, for instance, as charts:
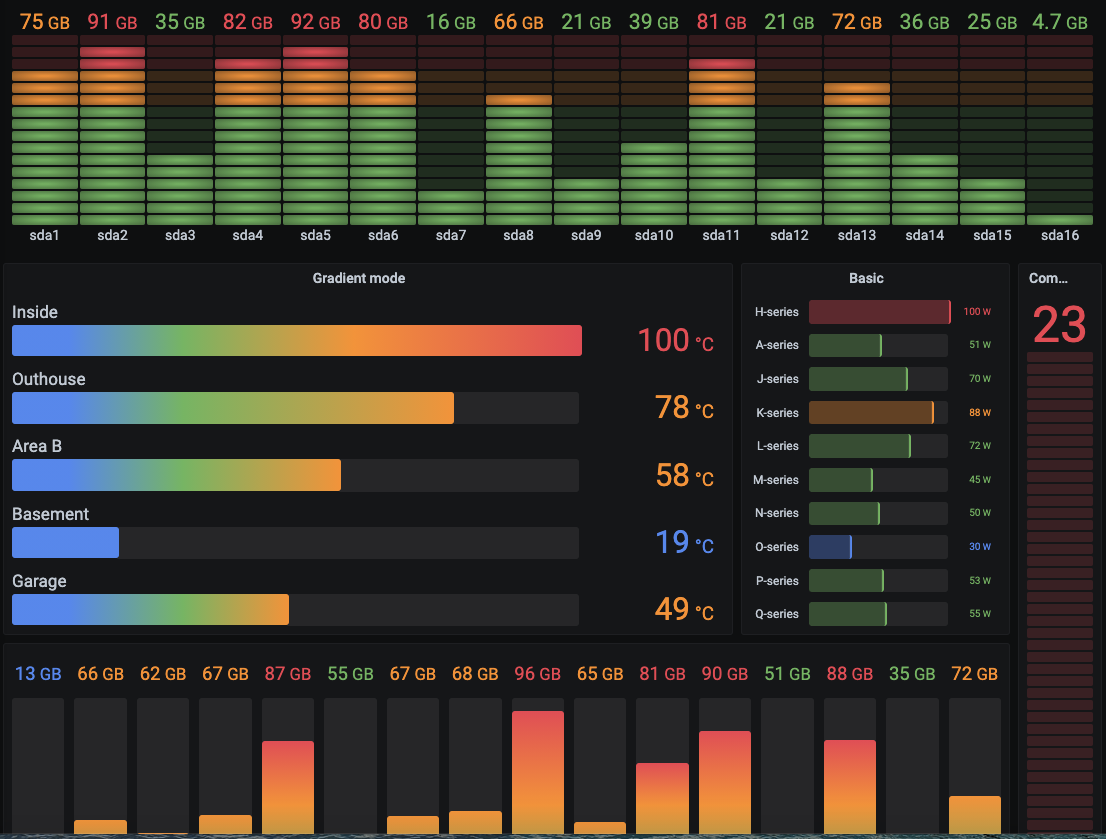
If you need to see values on the same panel with plot, you can also use a table representation: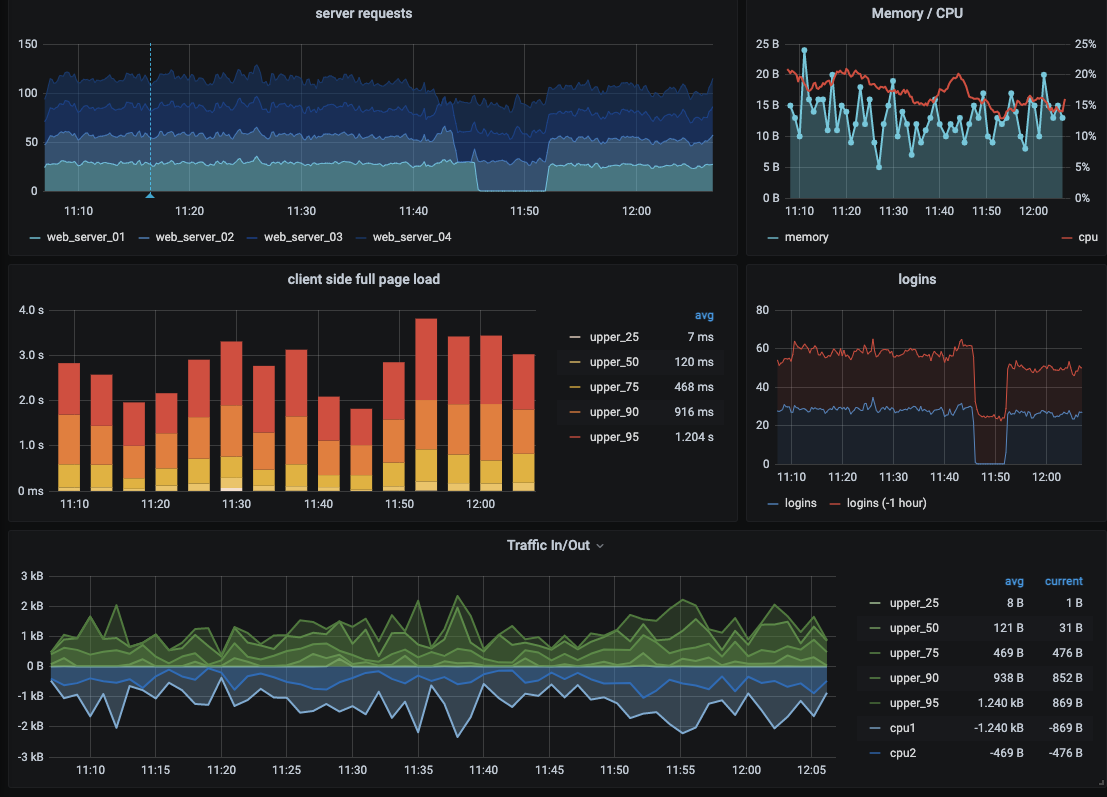
Another helpful visual representation can be a map: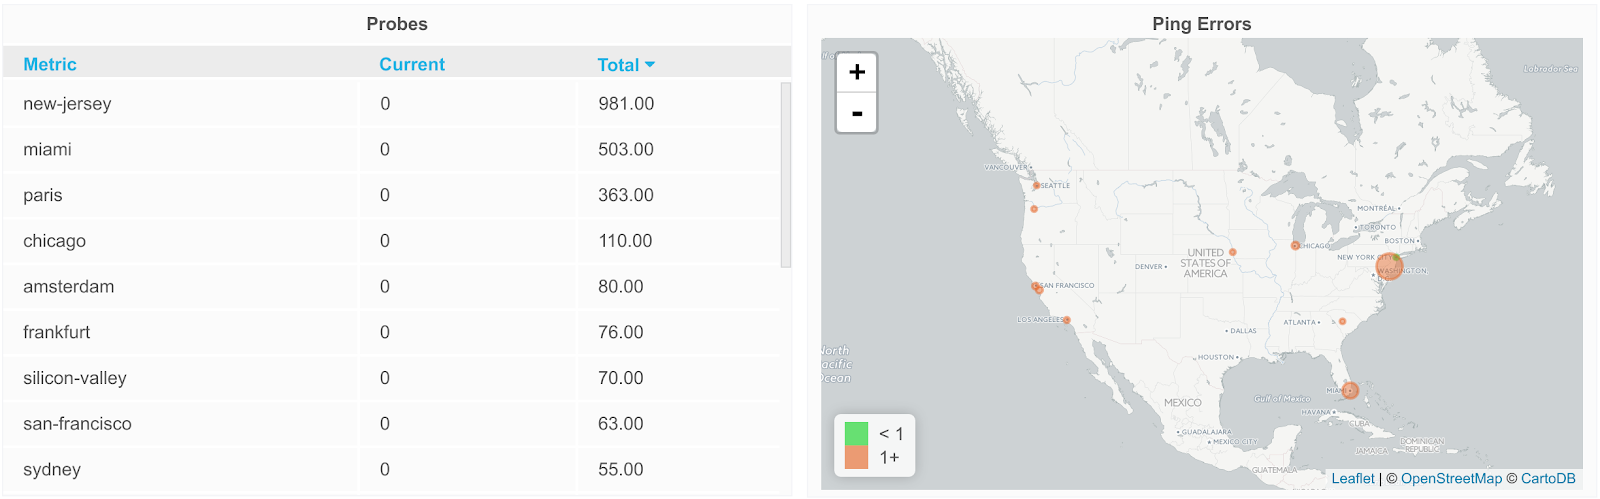
For special, custom data representation, you can also use an HTML plugin.
Conclusion
With the increasing amount of information, we will always resort to approaches that give us an effective methodology for analysis and visualization.
Grafana is one of the tools that can help you visualize and analyze a large variety of data sources. In addition, you can combine different display methods on a single page. This gives excellent results in practice.
You can contact Svitla Systems for help in organizing data visualization and building various information systems. Our engineers and system analysts have a wealth ofexperience working with various companies in this field. As a result, you will get the exact product that solves the tasks you want.